How to Set Up Prometheus and Grafana in Kubernetes with Alertmanager and Slack Alerts
Monitoring your Kubernetes clusters is a mandatory step, but the process doesn’t have to be intimidating. In this article, we will walk you through how to set up Prometheus with Grafana Dashboards on a Minikube cluster so that you can easily follow along. In addition to this, we will also explore how to send alerts to Slack using Alertmanager based on custom rules.
The examples can easily accommodate production clusters as well, you will just need to make some adjustments to the deployment parameters.
TL;DR? Check the video instead:
What is Prometheus?
Prometheus is an open-source monitoring system that is now part of the Cloud Native Computing Foundation (CNCF) at the Graduated level. It is designed for reliability and scalability, and works great in cloud-native environments and containerized environments like Kubernetes.
Prometheus works by scraping different metrics from your targets at specified intervals, storing them locally. It allows your users to query them by using a flexible query language called PromQL.
In Kubernetes it is the heart of monitoring, as it allows you to collect, store, and create alerts for everything that is happening in your clusters.
What is Grafana?
Grafana is an open-source visualization and analytics platform that integrates seamlessly with Prometheus. It transforms the raw data collected by multiple data sources into beautiful real-time dashboard and charts.
By doing so, it makes it easy for you to spot trends, detect anomalies, and troubleshoot performance issues at a glance. By integrating Prometheus data sources, Grafana gives you a visual way to understand what Prometheus is collecting.
What is Alertmanager?
Alertmanager is one of the core components of the Prometheus ecosystem which is responsible for handling alerts. These alerts are generated by Prometheus rules, and when Prometheus detects a condition that matches an alert expression (e.g. High CPU usage, low memory), Alertmanager receives that particular alert and decides what to do with it.
Setting up the Prometheus/Grafana/Alertmanager Stack on Kubernetes
Now that you know what Prometheus, Grafana, and Alertmanager are, let’s deploy them into a Minikube cluster, to make it easy to test locally, while keeping the setup close to what you would need to run in a production environment.
Prerequisites
For this example, you will need:
- A Kubernetes cluster (Minikube works just fine): installation guide for Minikube is available here
- Lens Kubernetes IDE for better management of everything that is happening: You can download Lens from here.
- kubectl
- helm
Installing the Prometheus Stack Helm Chart
We will use the kube-prometheus-stack Helm chart from the Prometheus community. It includes Prometheus, Grafana, and Alertmanager, all managed by the Prometheus Operator.
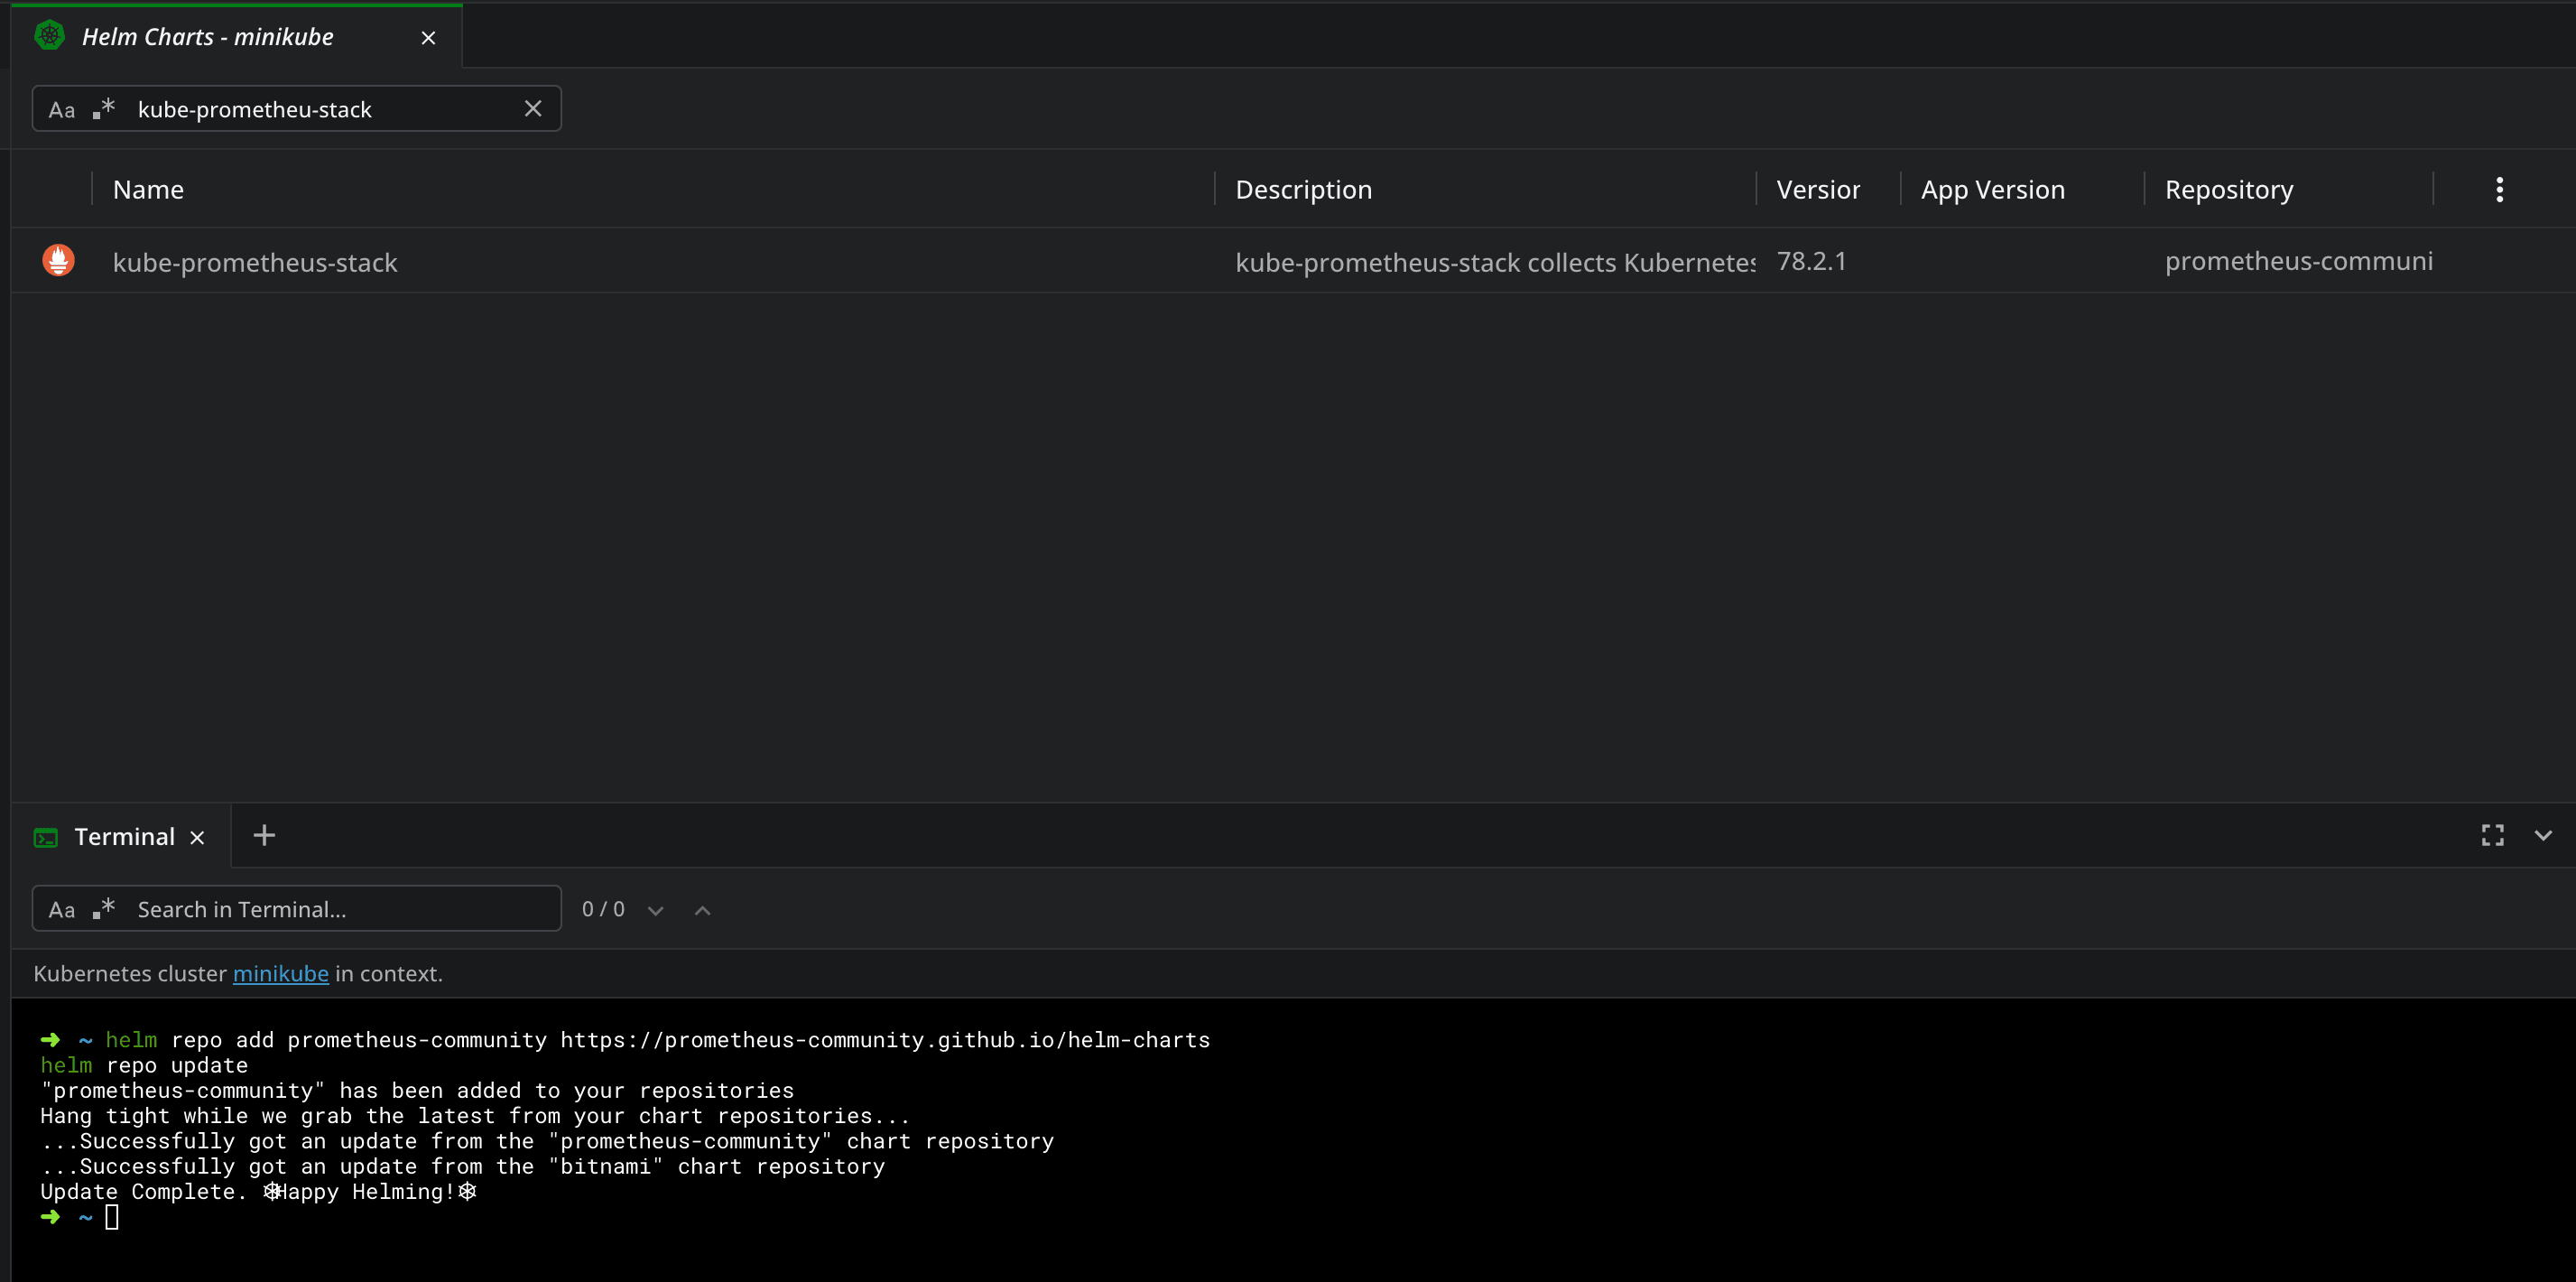
To add the Helm repository simply run:
helm repo add prometheus-community https://prometheus-community.github.io/helm-charts
helm repo update
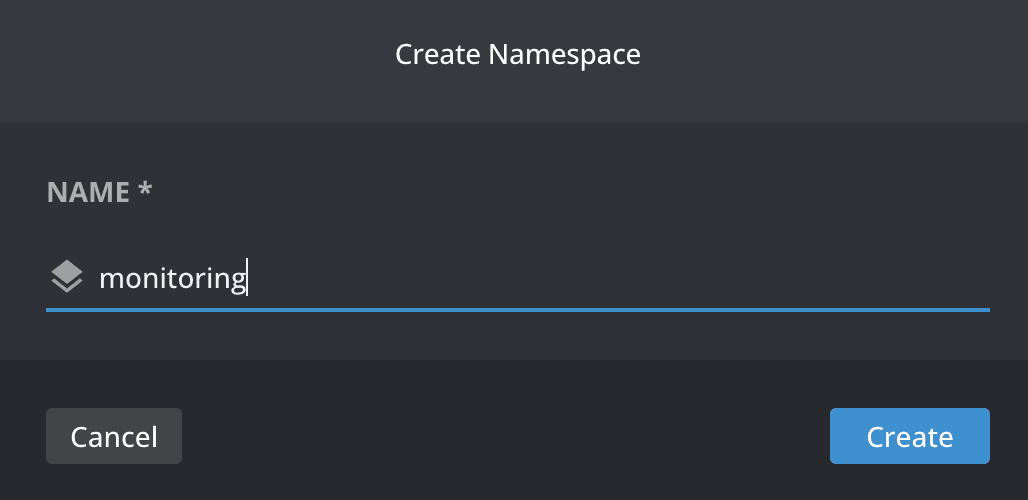
Next, go to Lens Kubernetes IDE, in the namespaces tab, and click on the plus button to create a new namespace. Let’s call it monitoring:
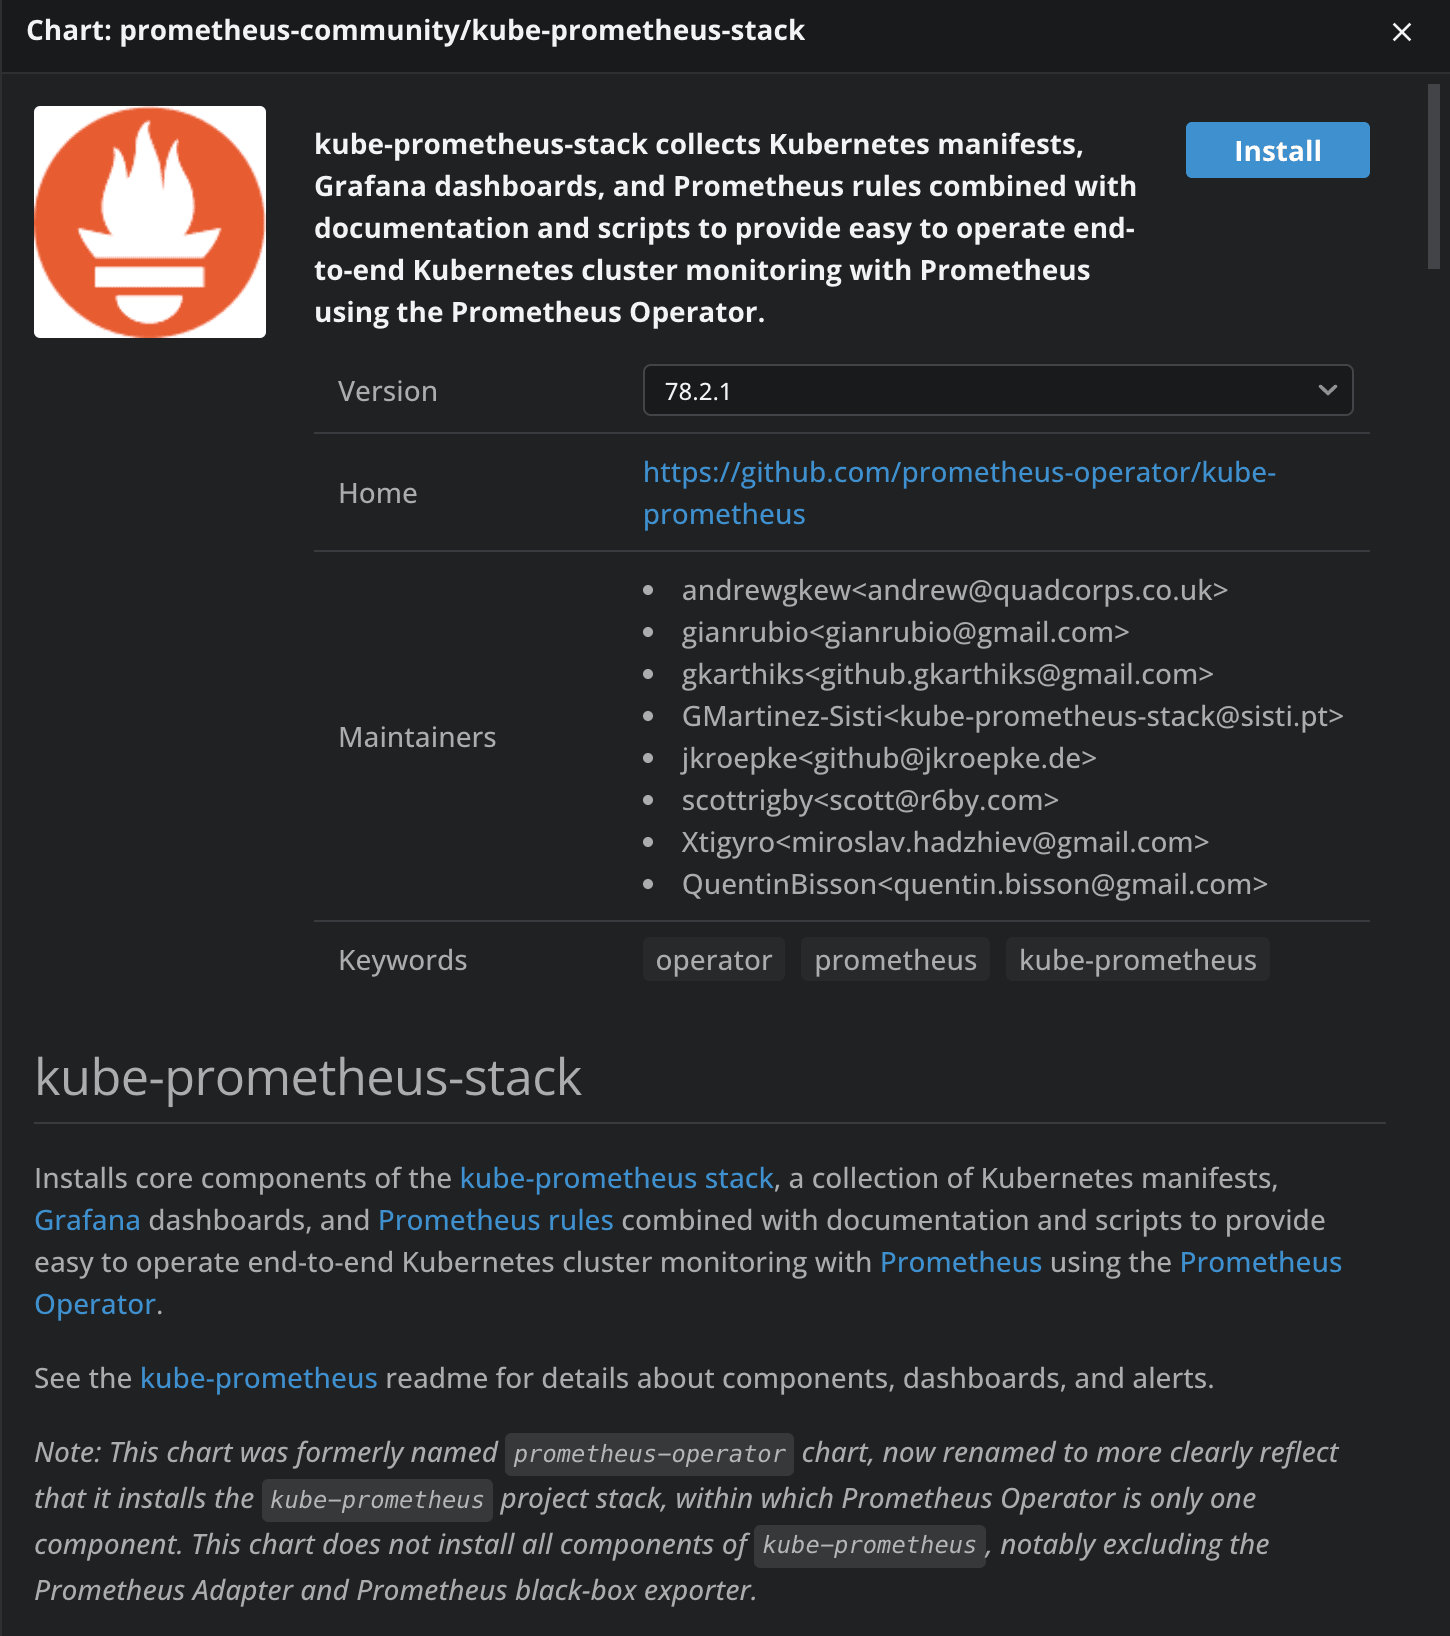
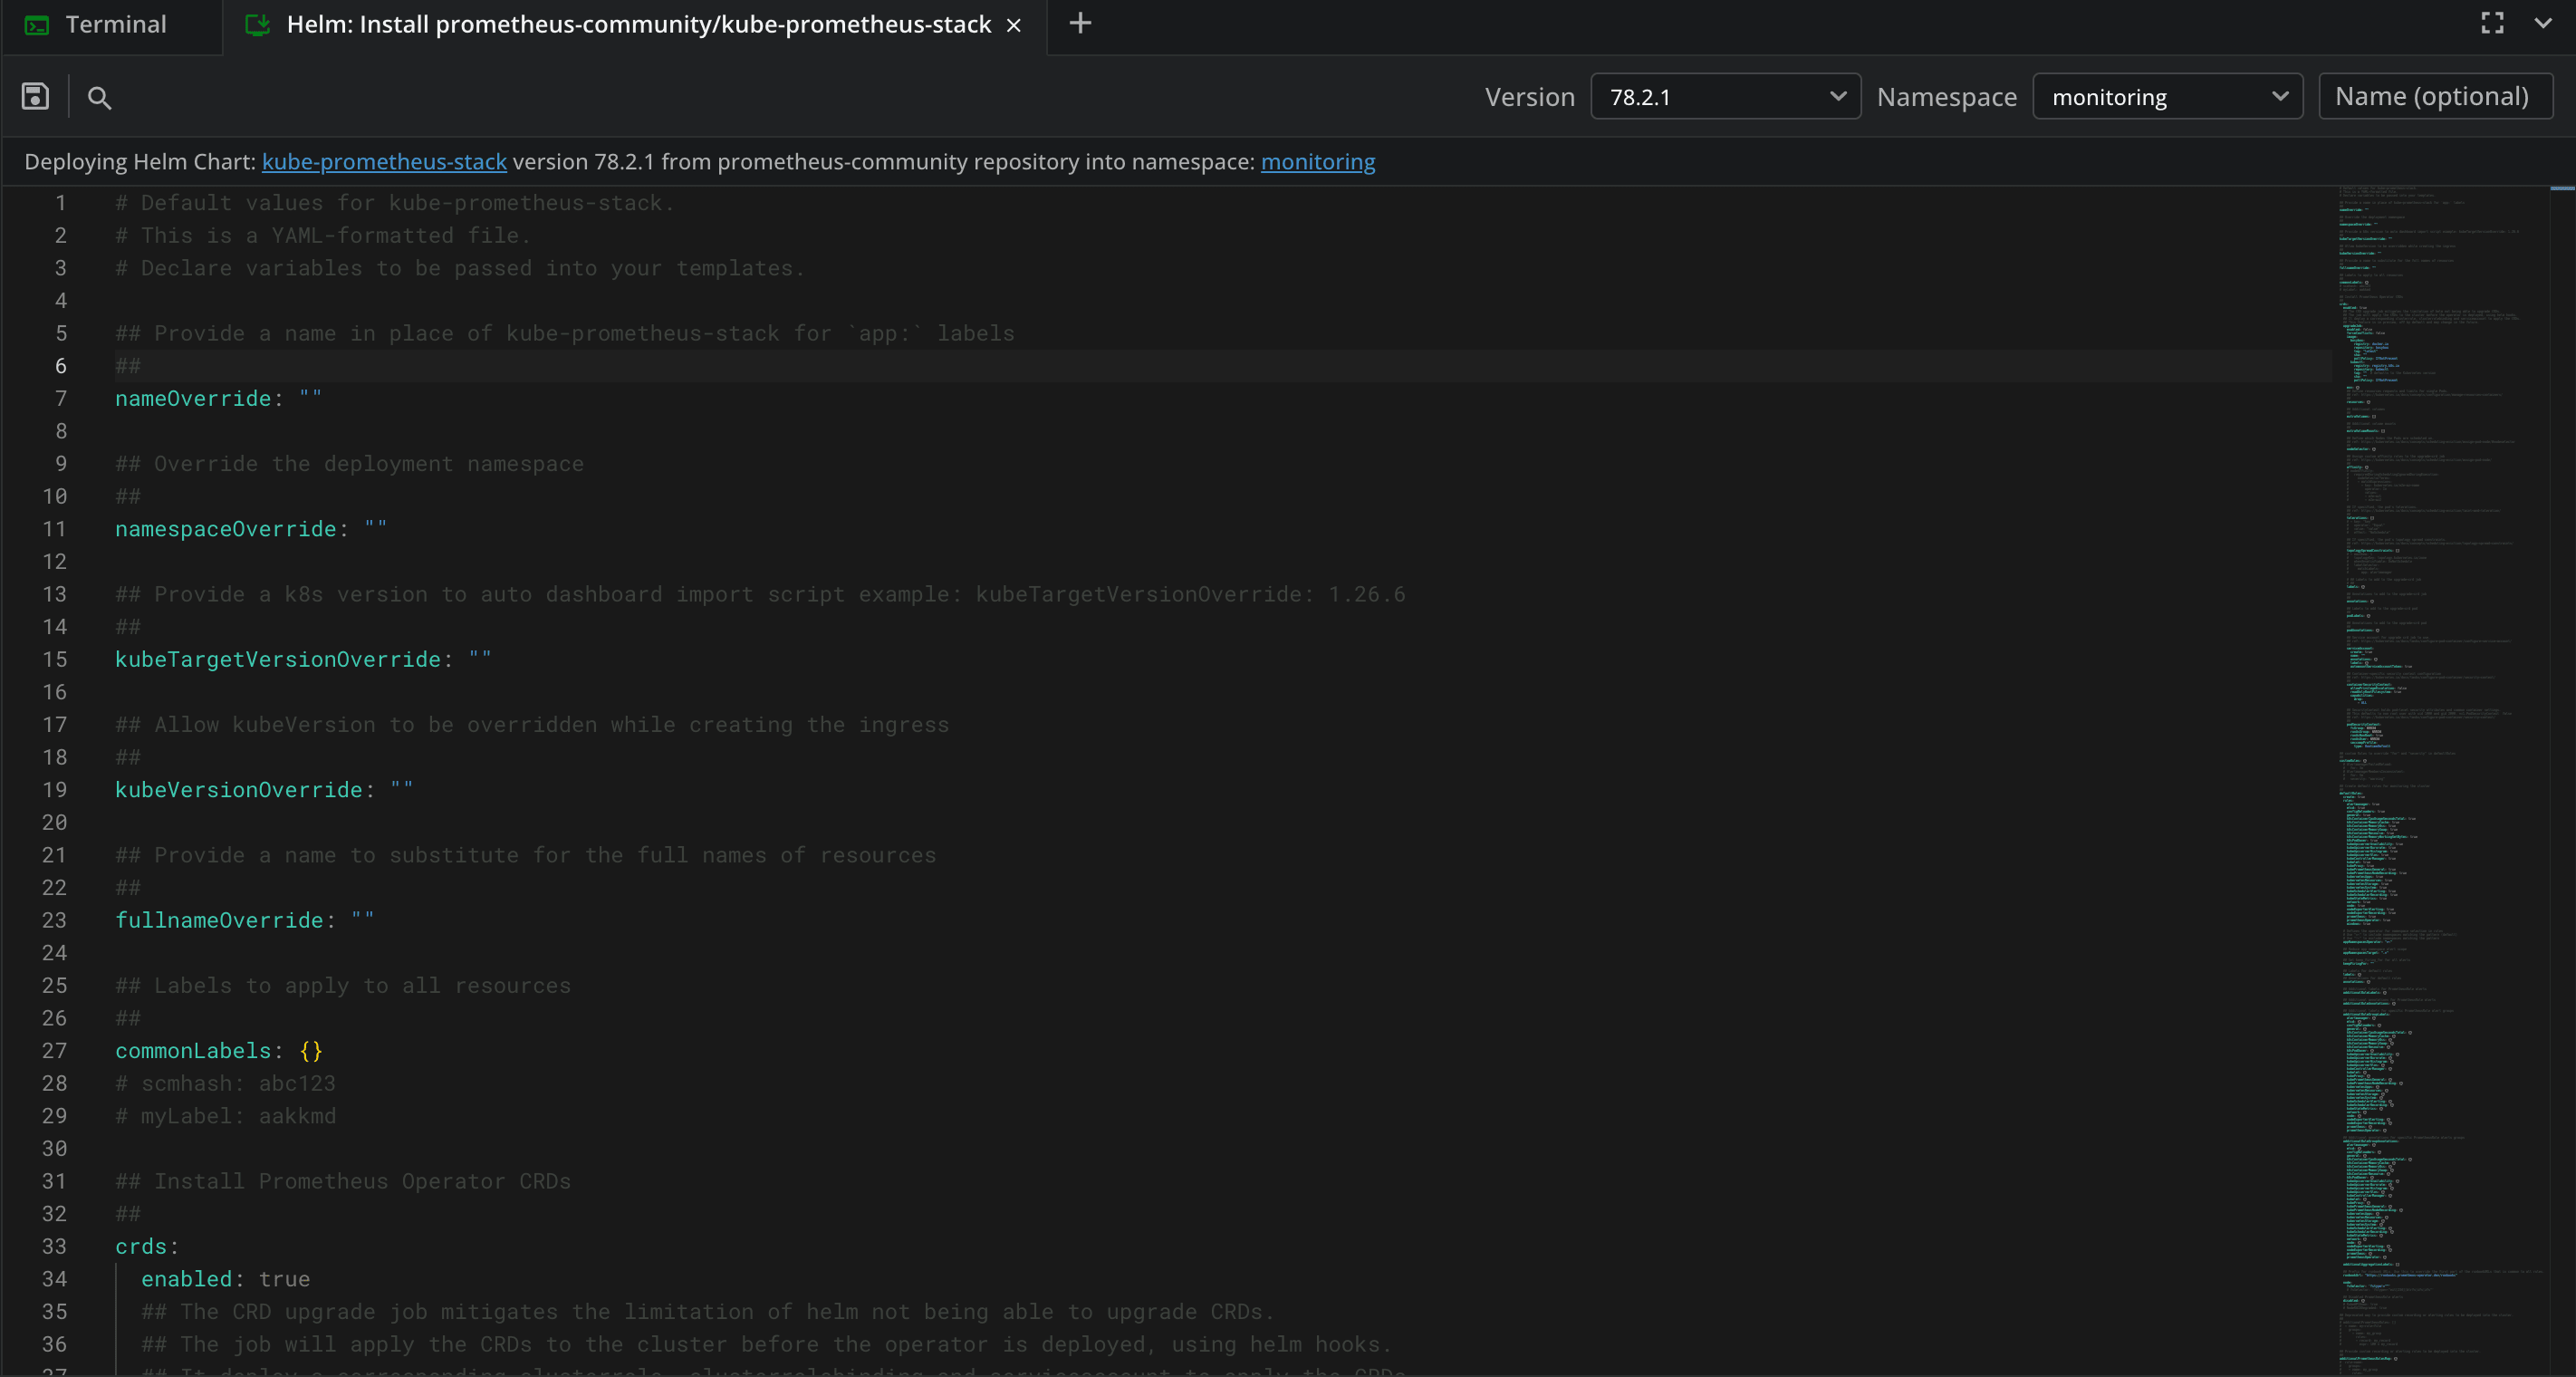
Now go in the Helm tab and search for kube-prometheus-stack, and click on it.
Next, you need to select a version (choose 78.2.1 if you want to walk through the exact same setup) and then click on install.
Make sure you select the monitoring namespace, and here is the place in which you can make changes to the helm chart values. For this example you can leave them as they are.
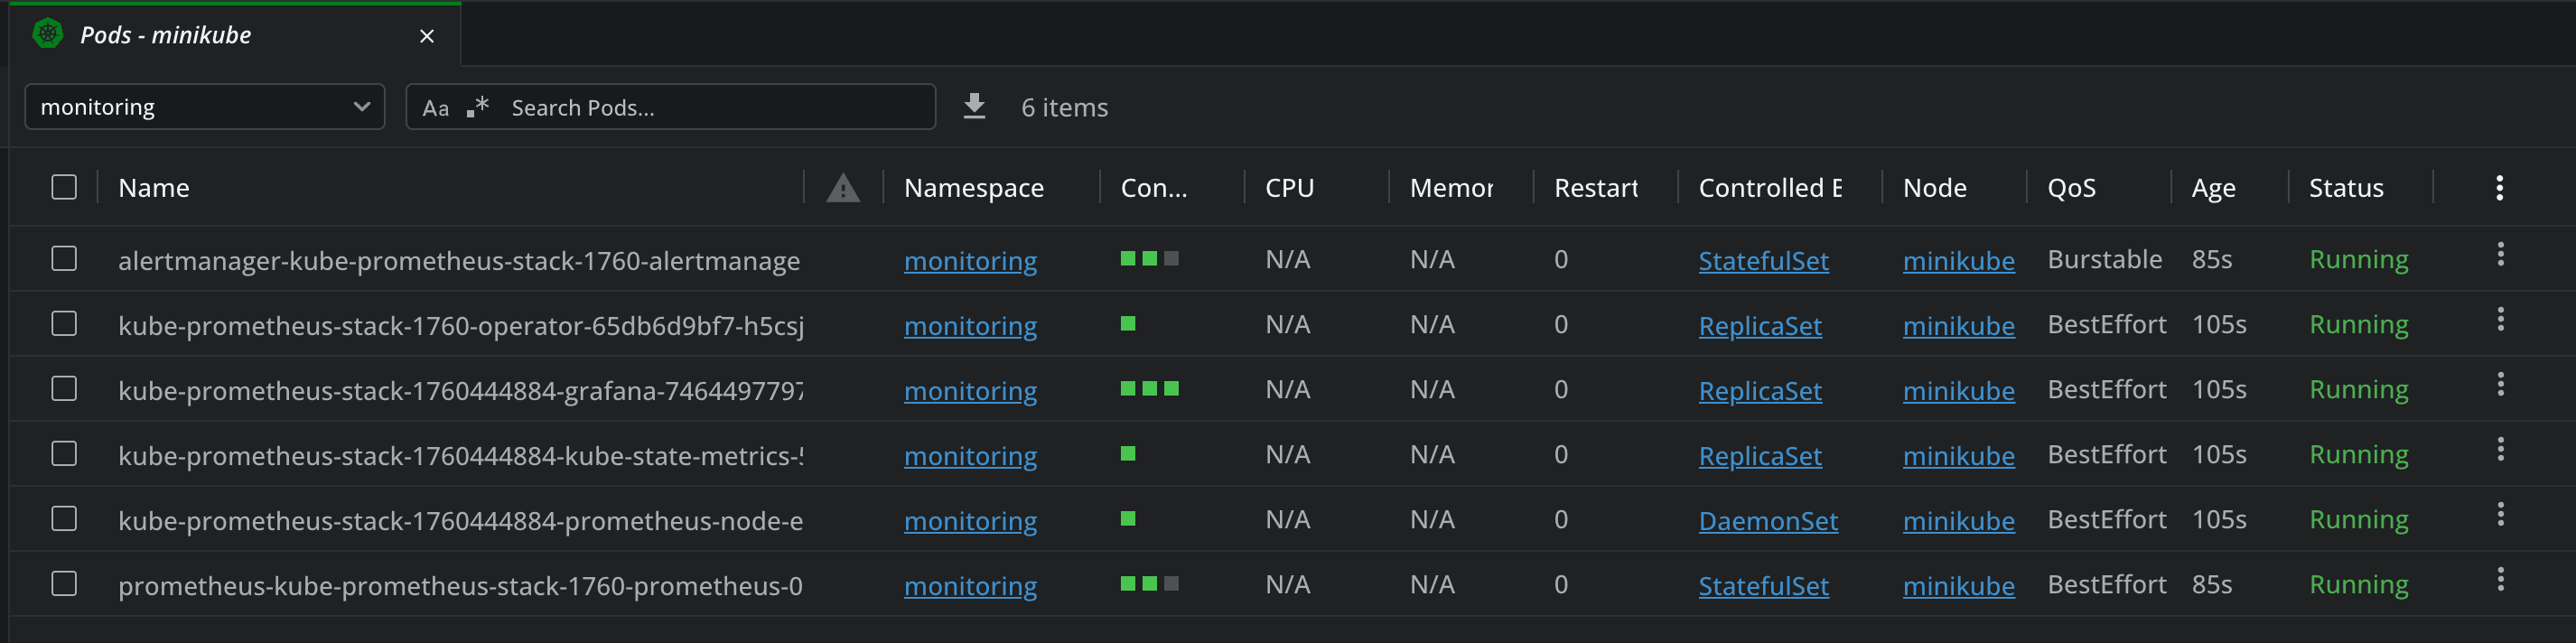
Then, after you click on save you should receive a message that the installation was successful. You can go to the pods view, and after approximately 2 minutes, all pods should be in a running state:
Accessing Grafana Dashboards
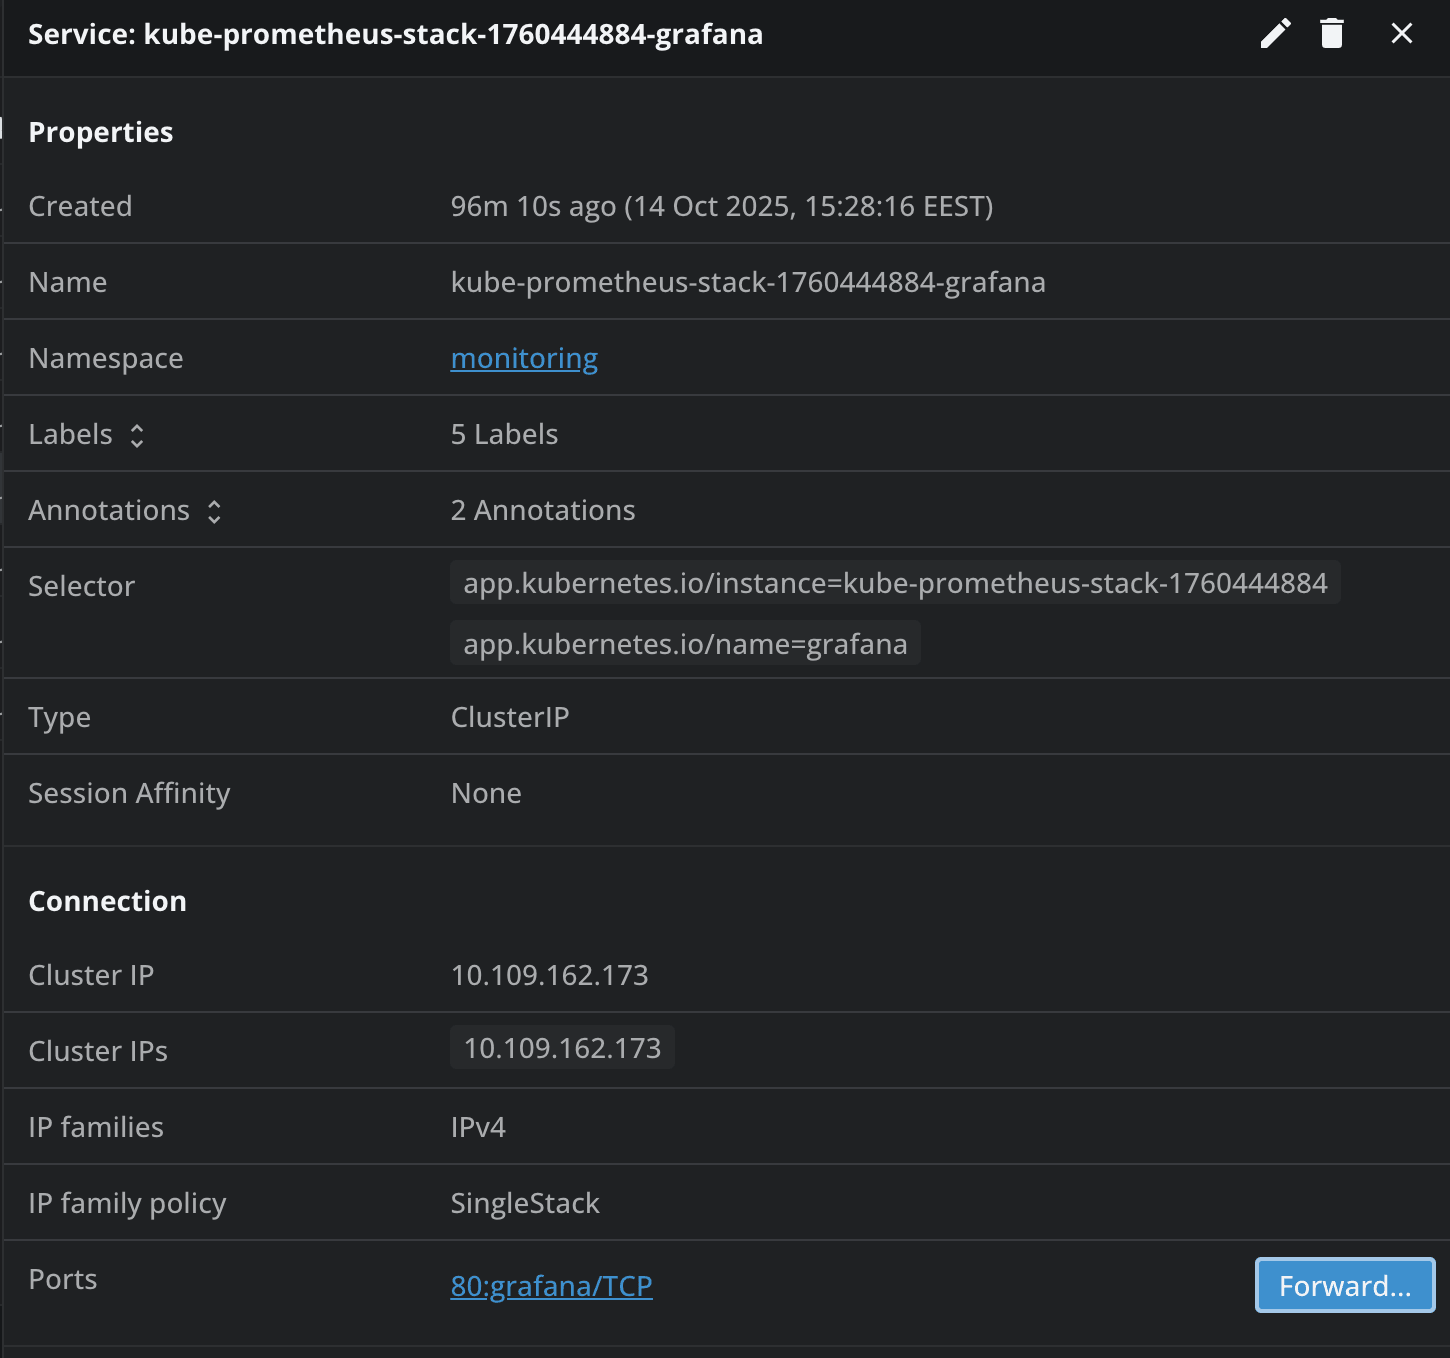
Now if we go to the services tab, we can easily port-forward to the Grafana instance:
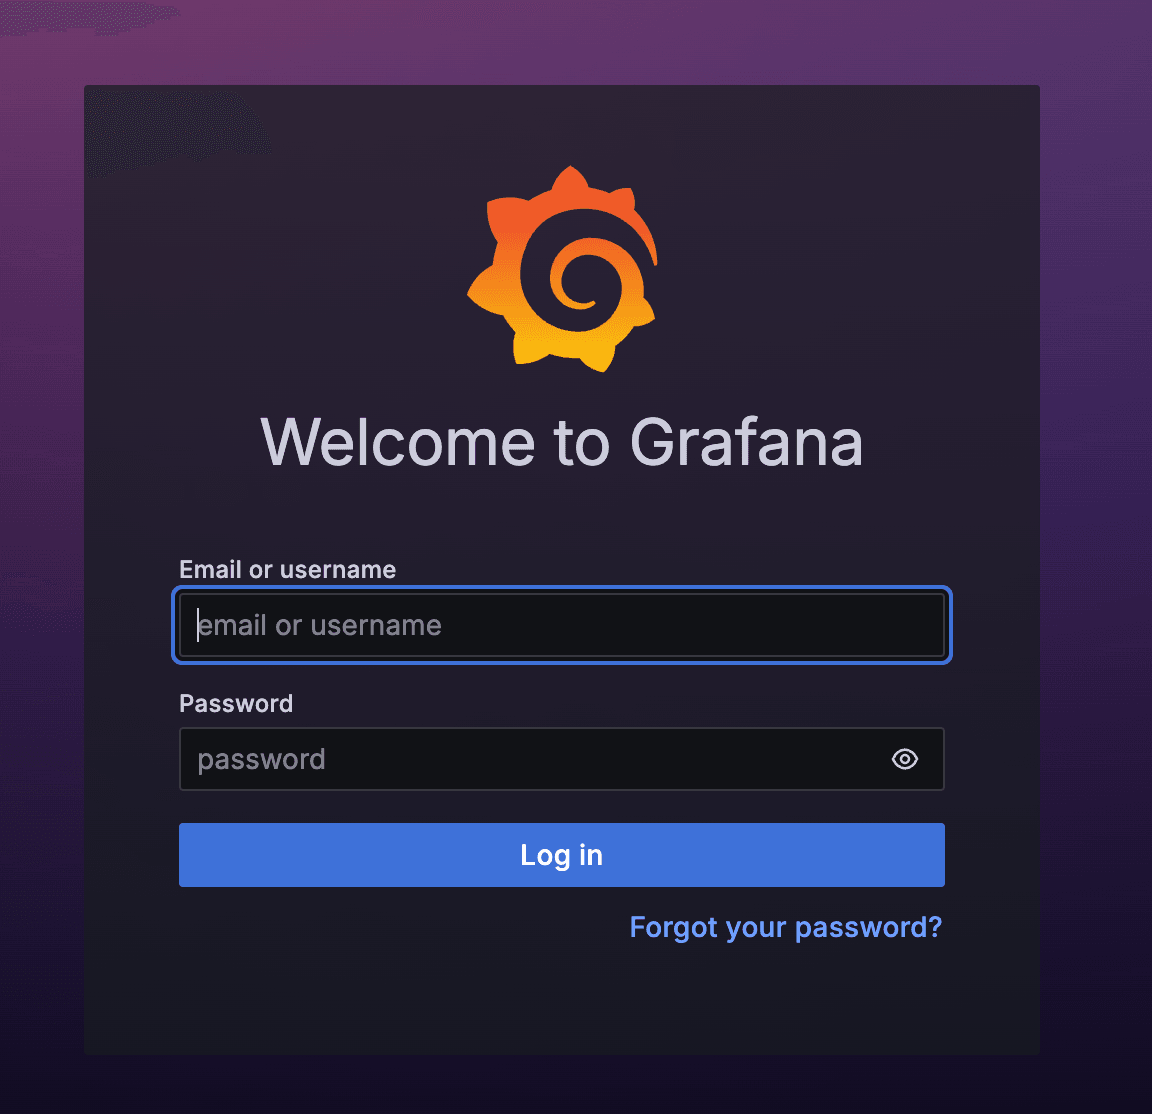
After you click on Forward, the browser will open and you will redirected to Grafana:
To get the admin username and the initial admin password, inside of Lens Kubernetes IDE you can go to Configs -> Secrets and select the Grafana secret:
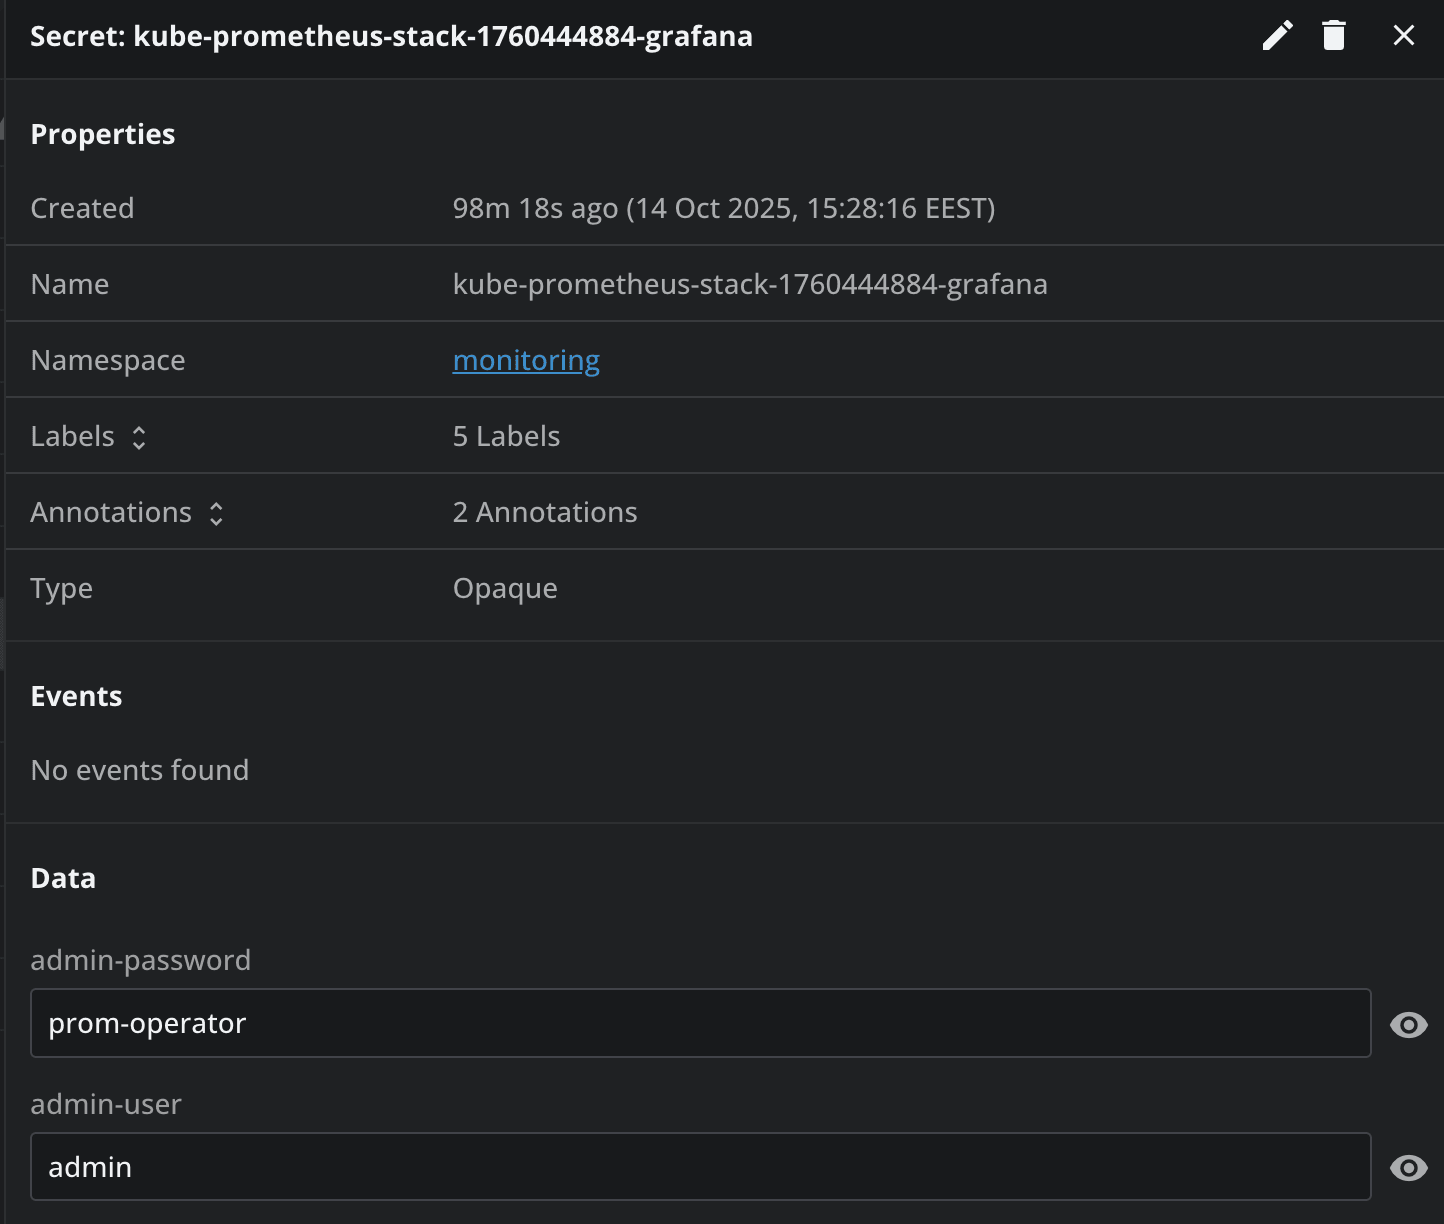
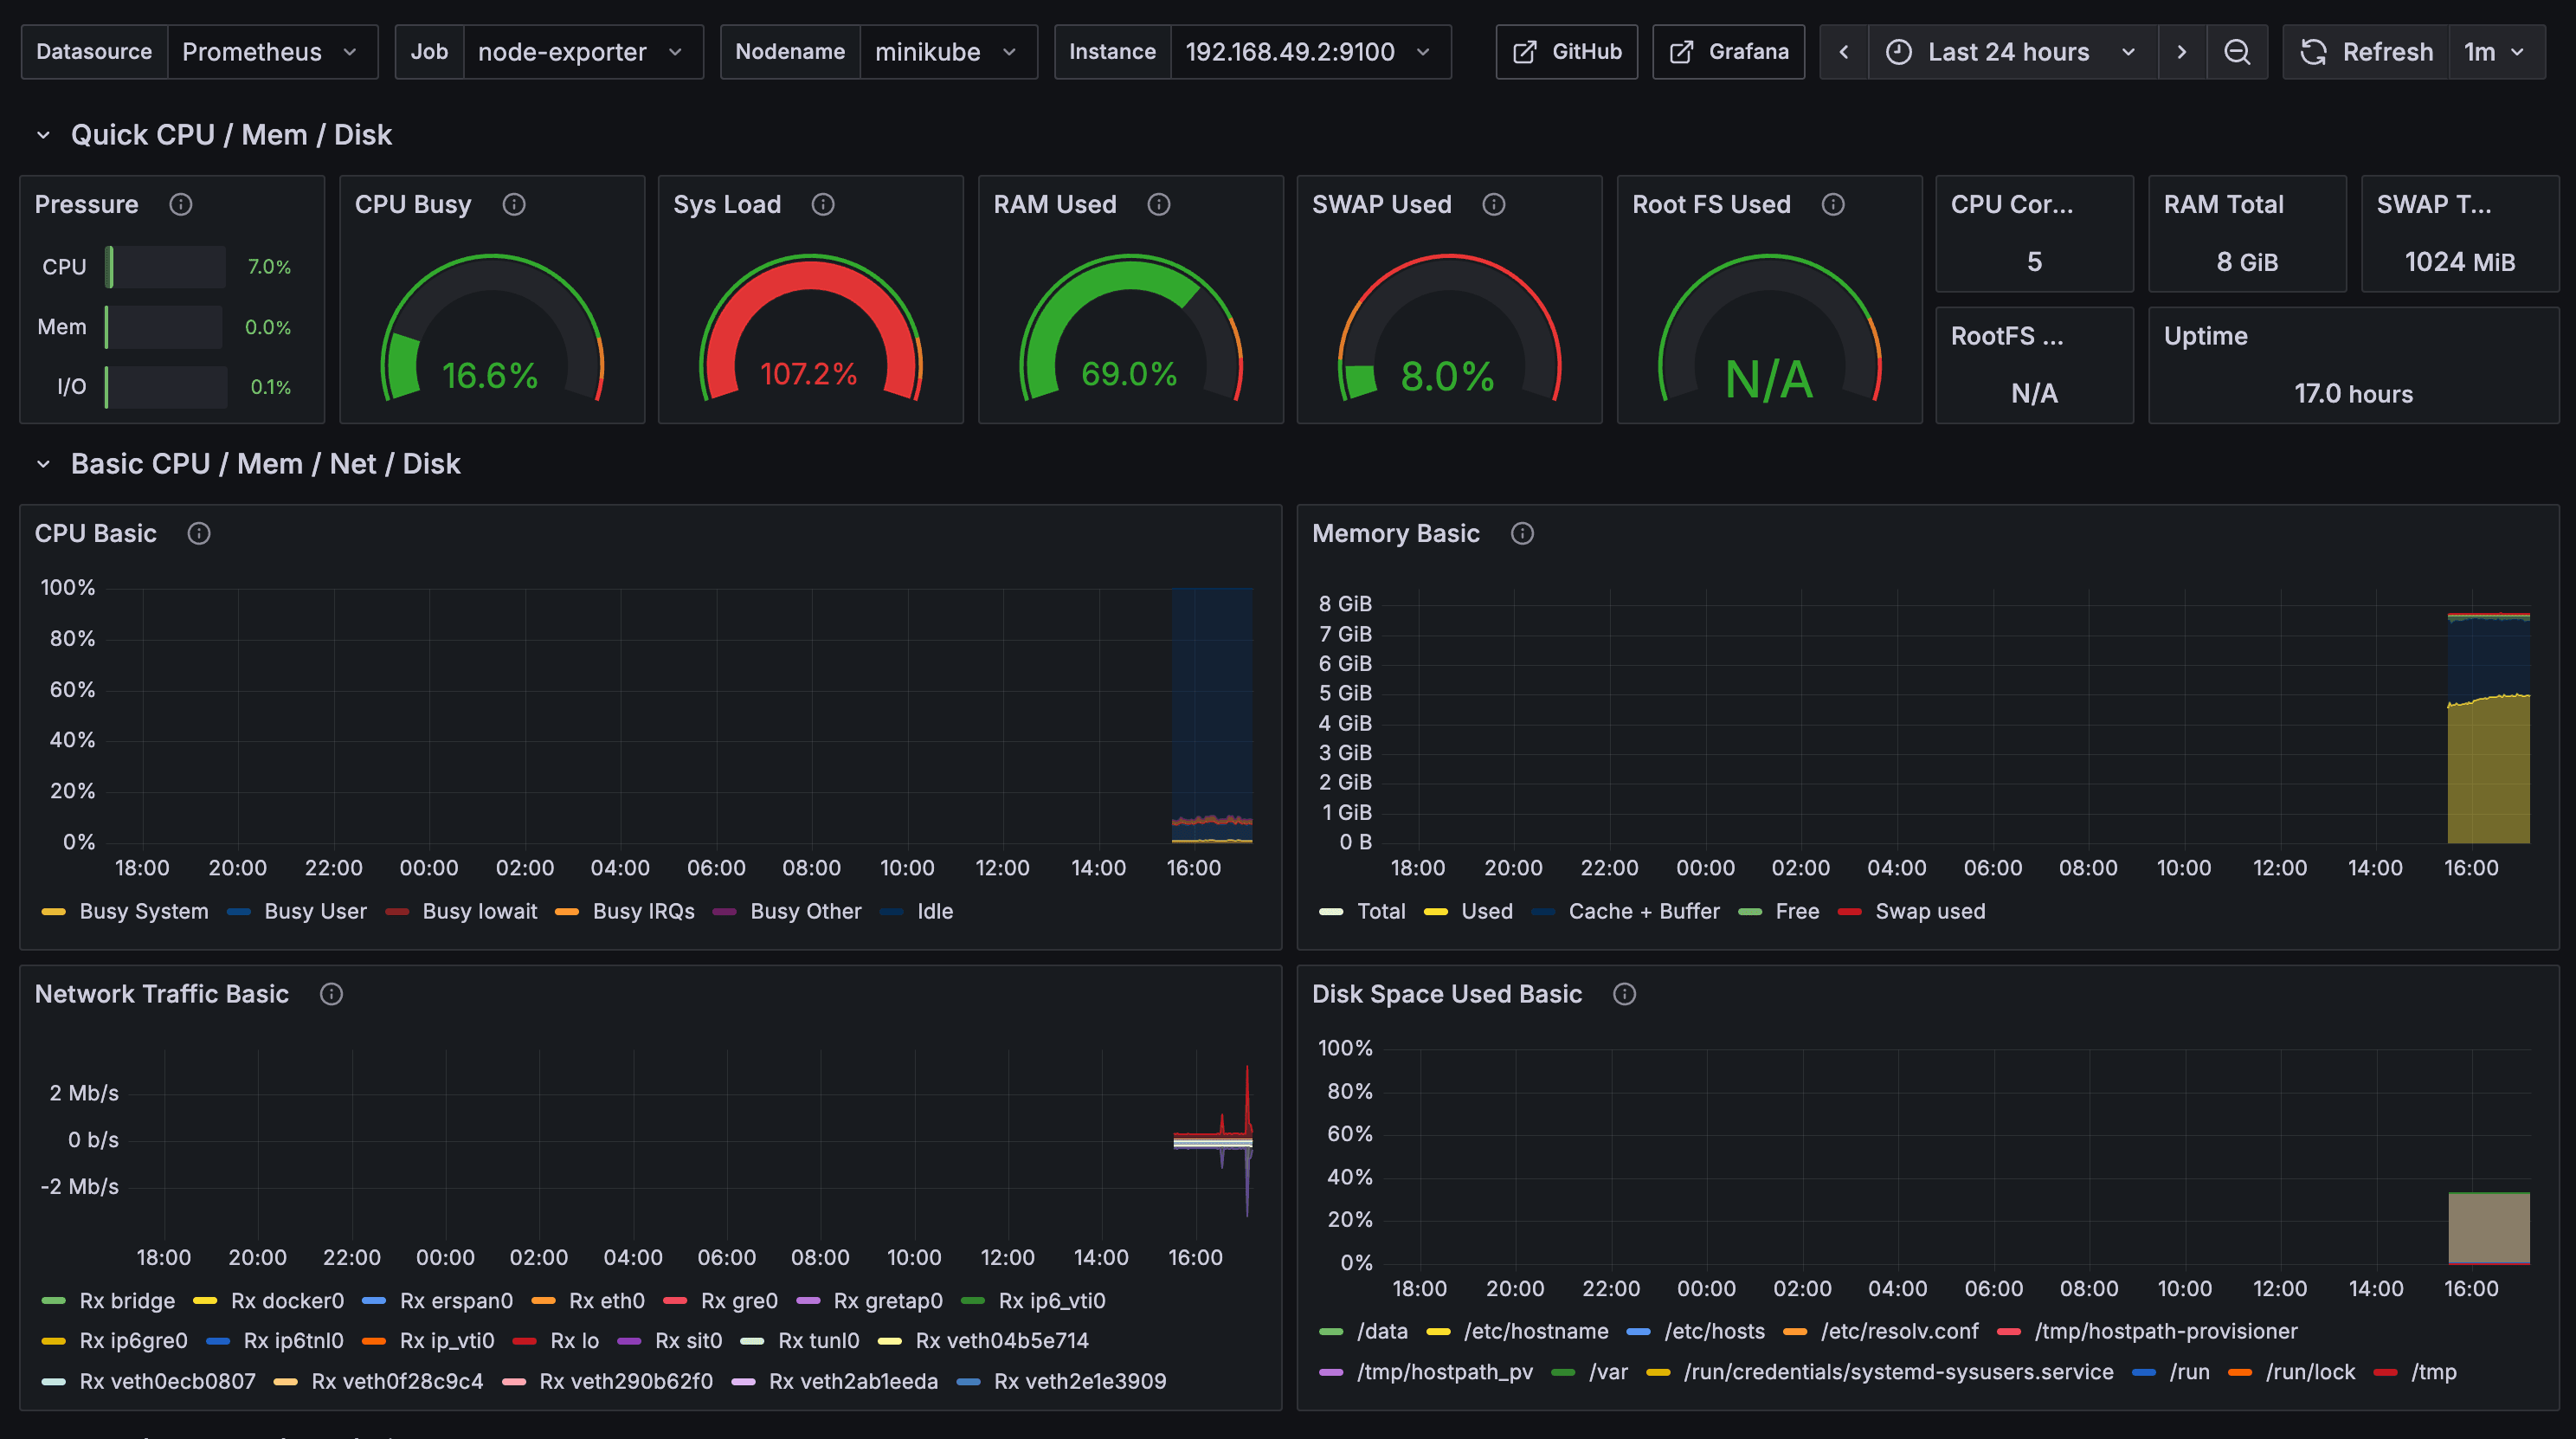
Login using these credentials, and lets import a dashboard just to see if everything is working fine. To do that, in Grafana, go to Dashboards, then click on New, and select Import. Add the 1860 dashboard ID as this is the Node Exporter Full (great for node metrics).
Configuring Alertmanager for Slack Notifications
First go to Slack, and create a new application, and name it however you want. You can click here to be redirected to the create an app Slack workflow.
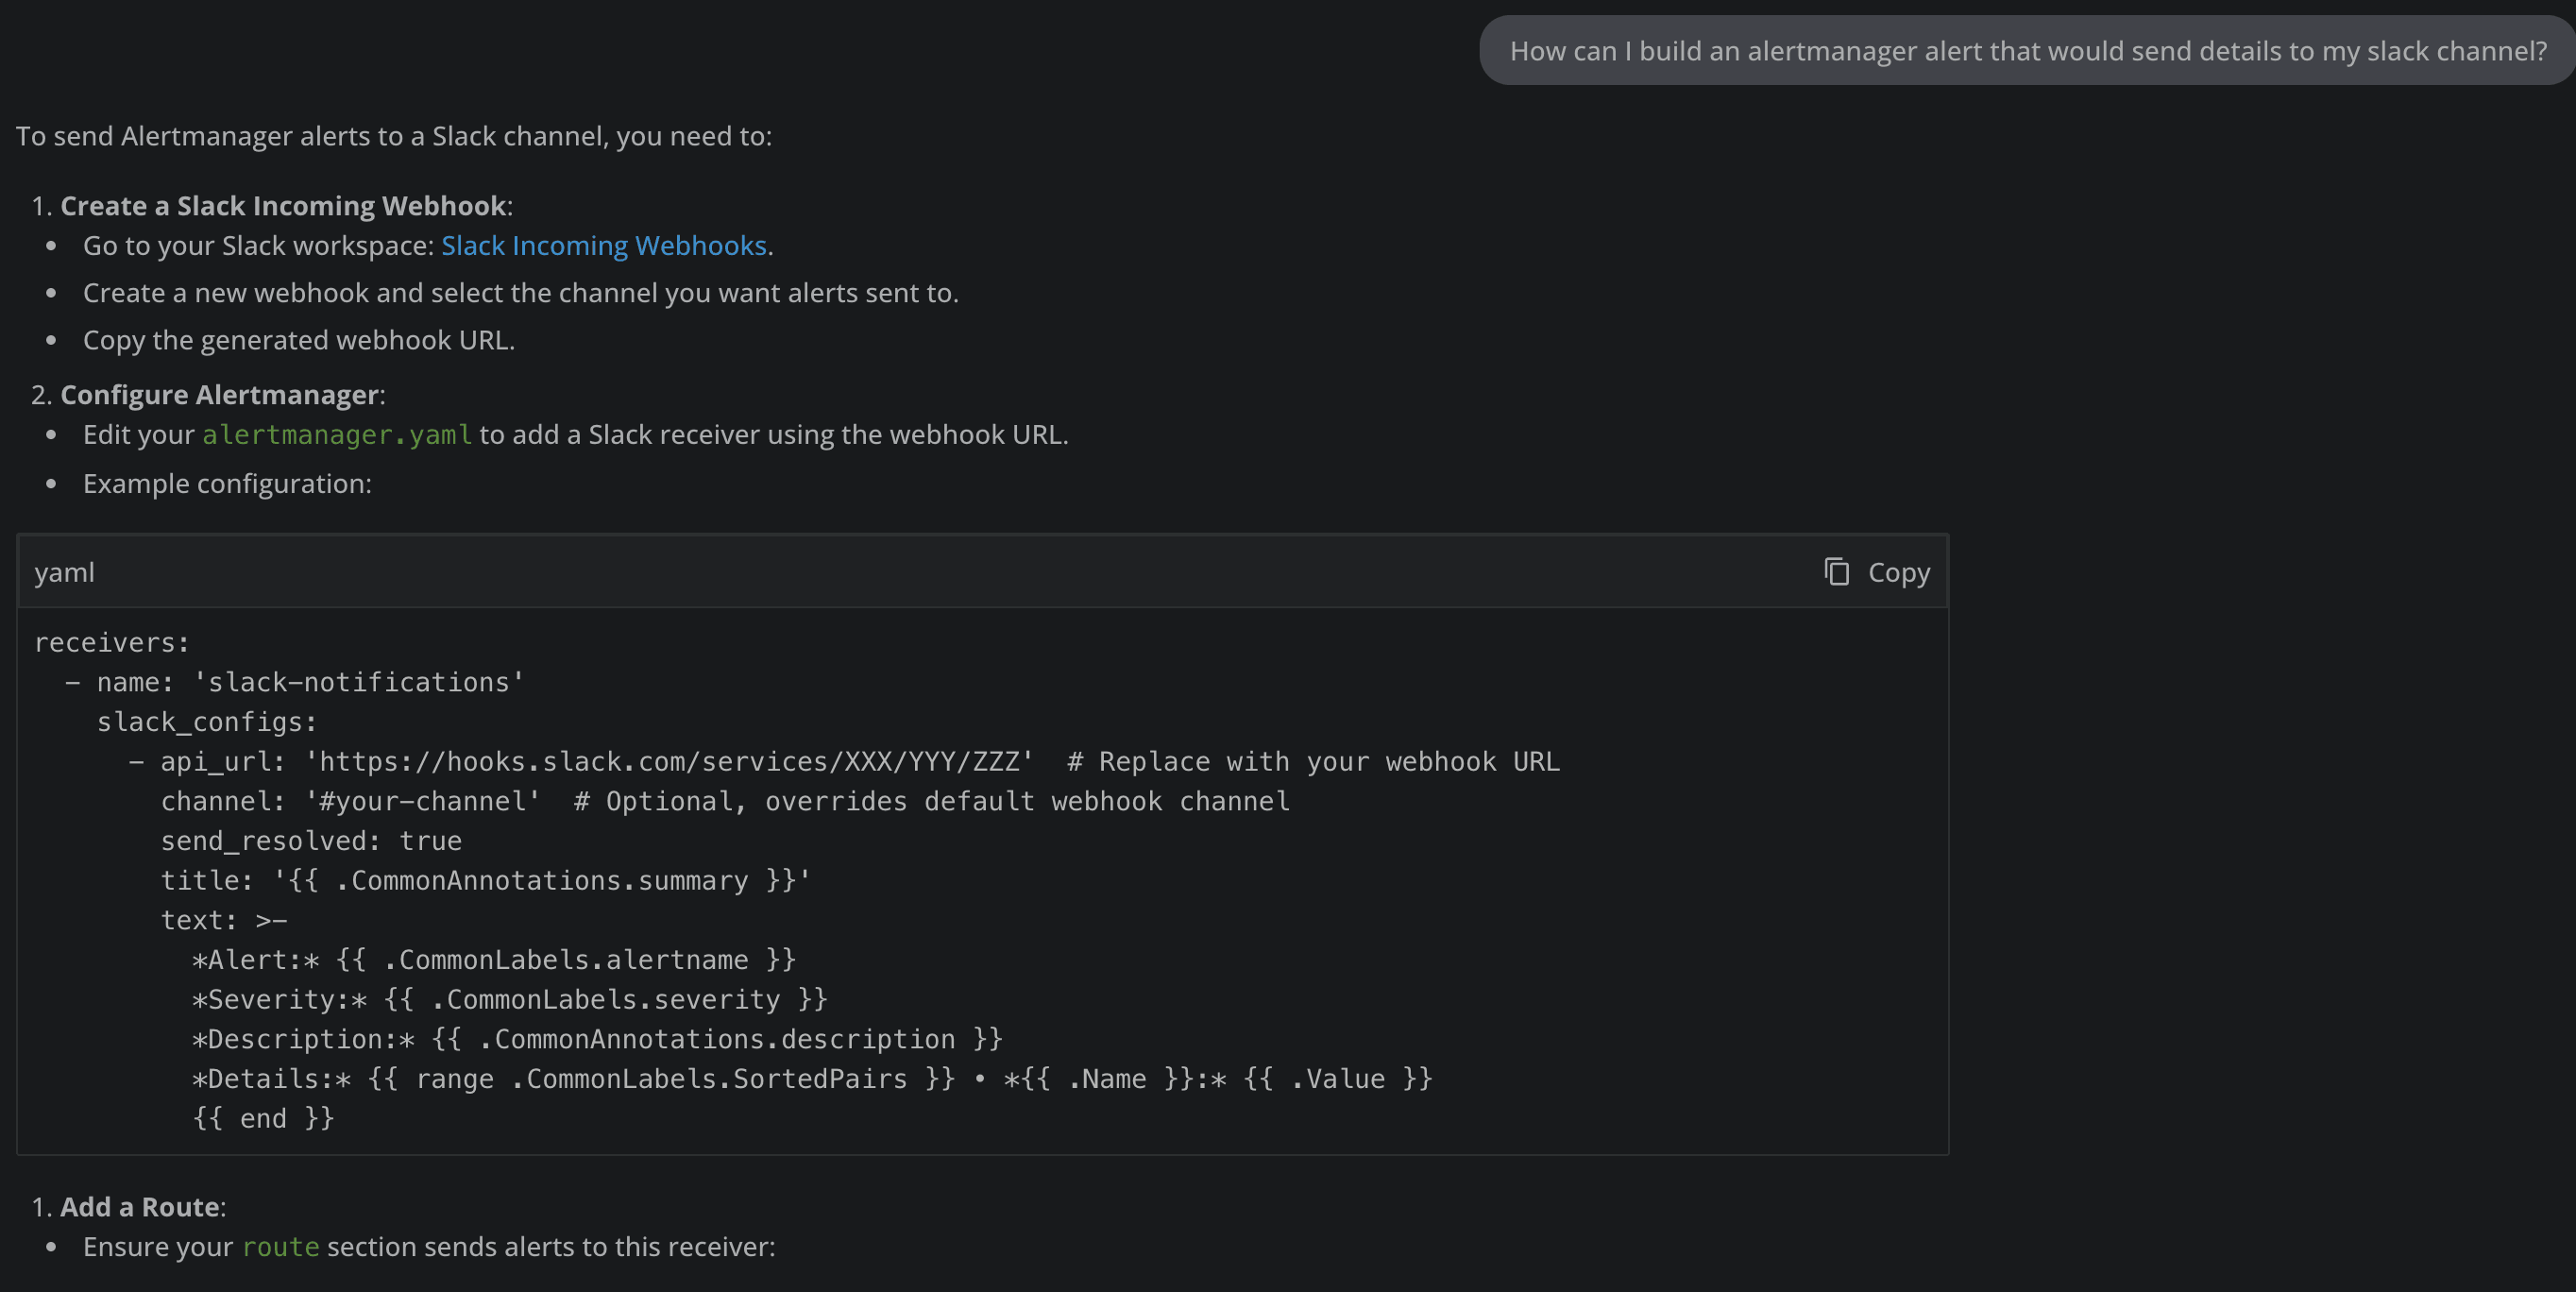
NOTE: You can also ask Lens Prism how to do this, and by walking through the steps it provides, you can have this up in no time:
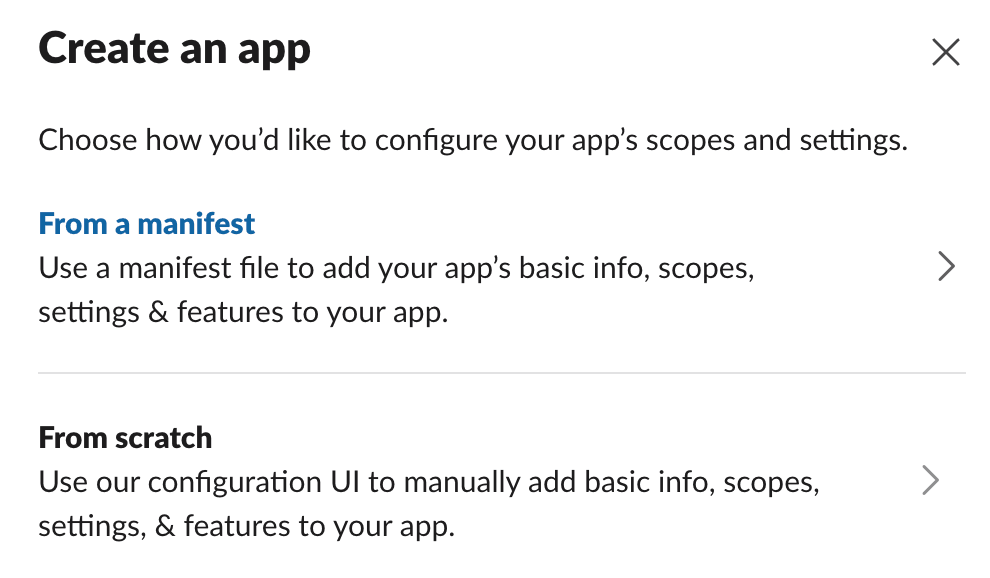
Let’s continue walking through the setup. As soon as you click on Create a New App in Slack, you will have two options, one will let you create the application from a manifest, and the other one, will be from scratch. Let’s use the from scratch option.
After you select the From scratch option, you will need to provide an application name, and pick the workspace in which you want to develop your application in.
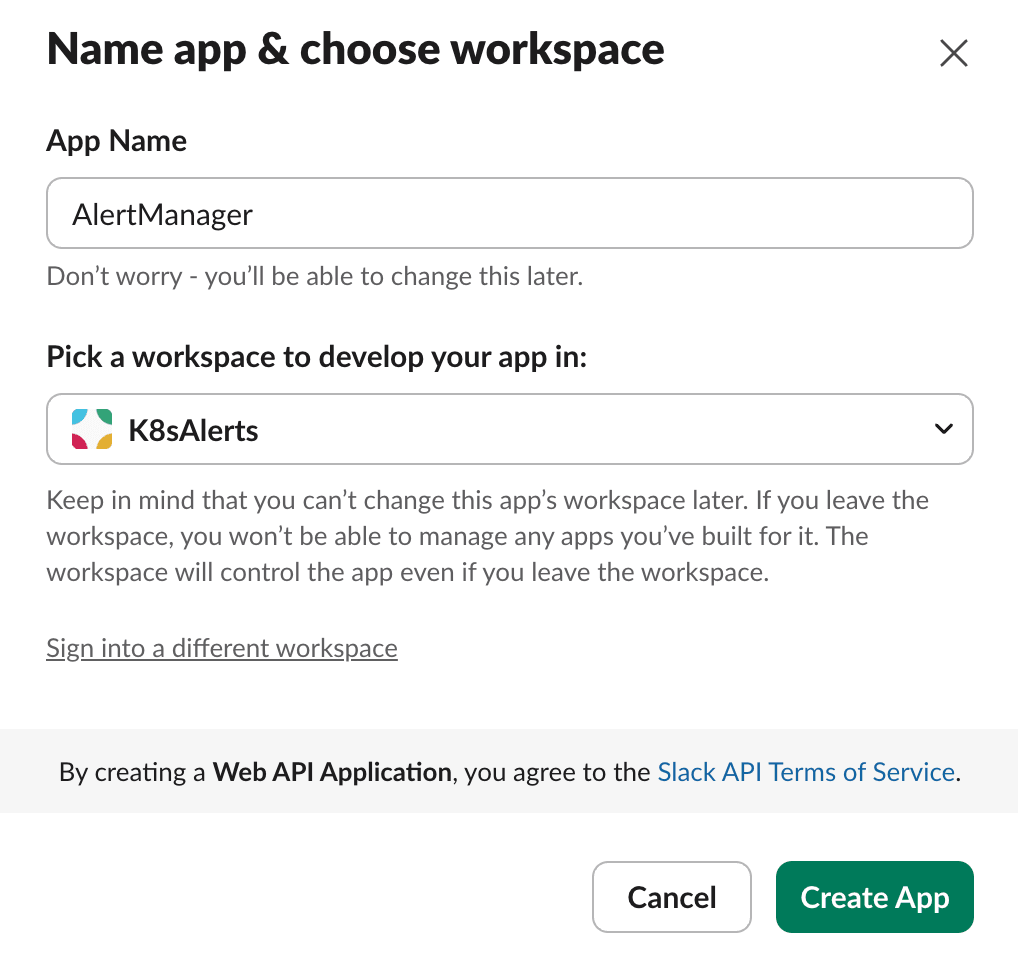
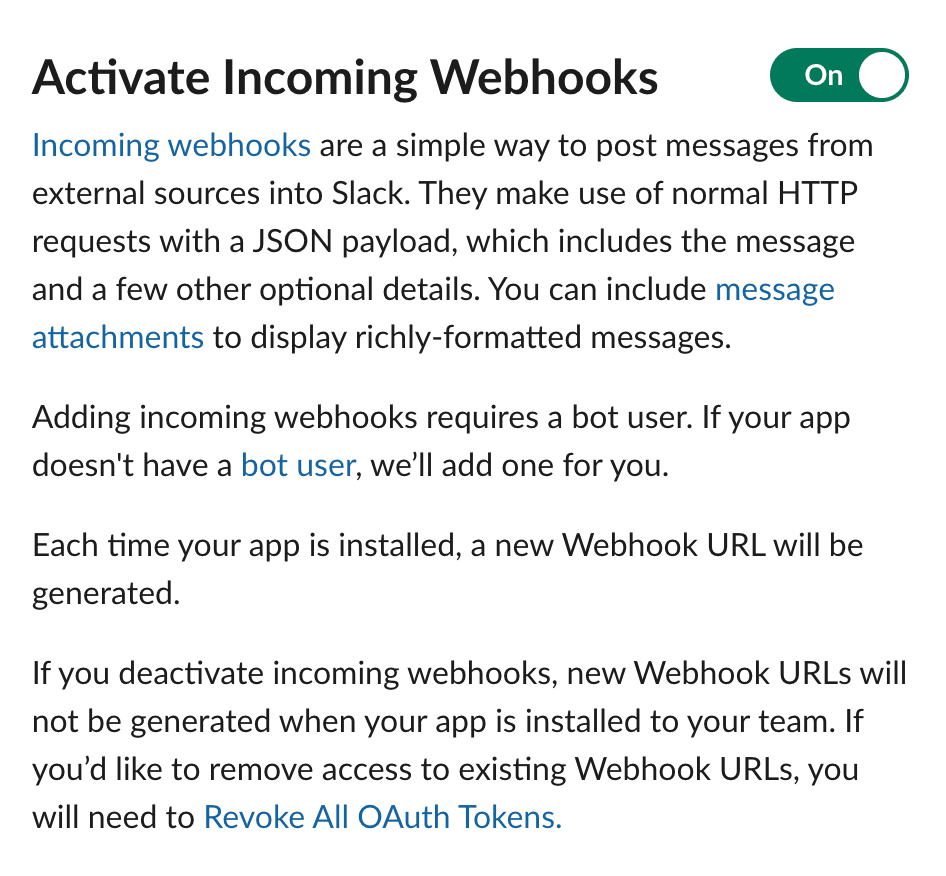
Then, after you select Create App, you will be redirected to your application credentials, but we will need to navigate to Features → Incoming Webhooks, and activate this option.
Next, go to the bottom of the page and click on Add New Webhook.
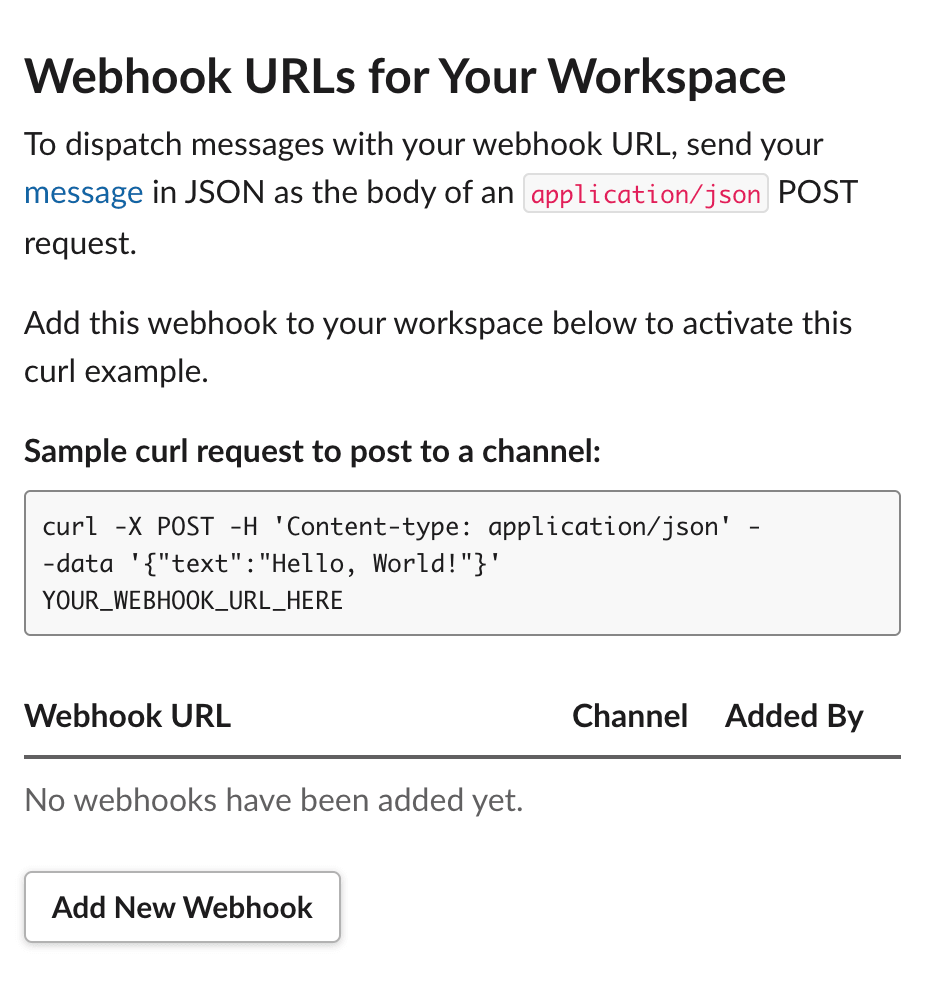
Select a channel in which you want to send alerts and click on Allow:
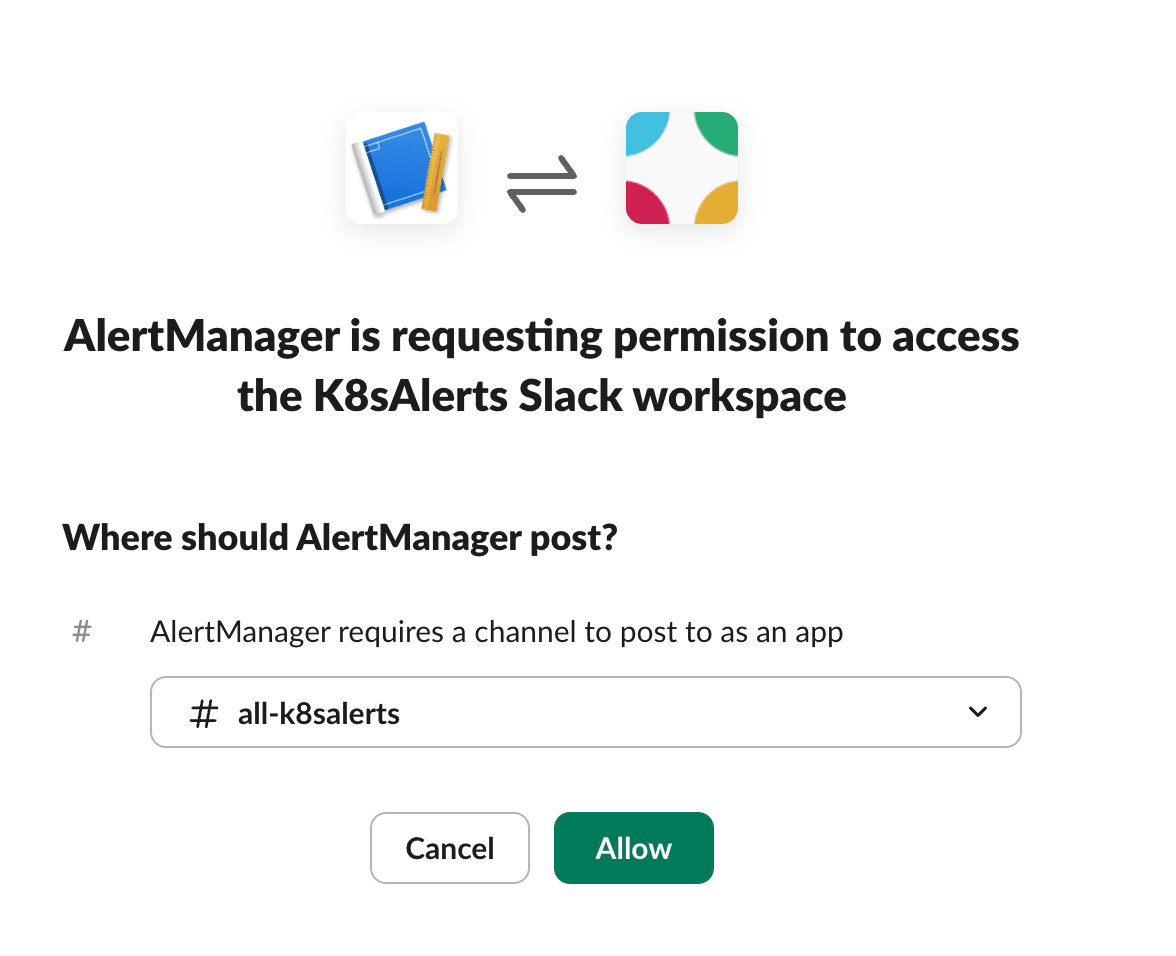
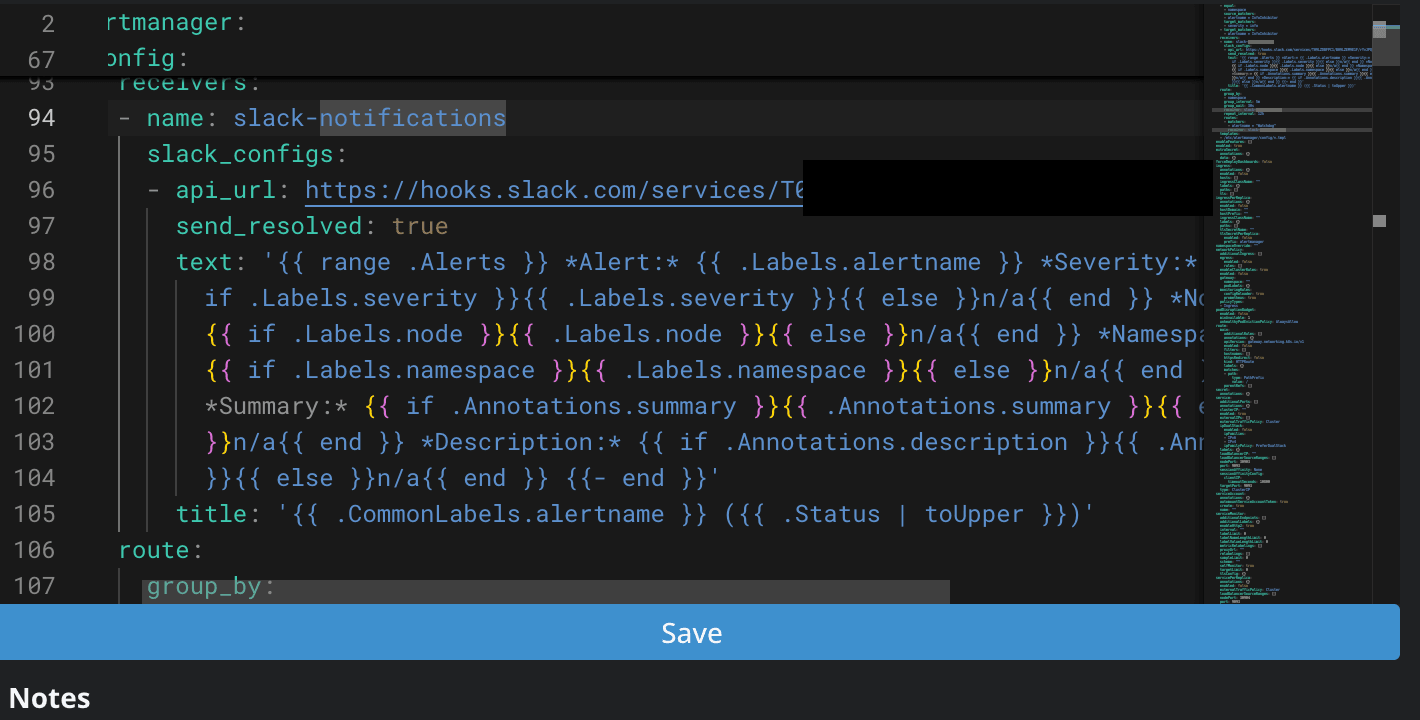
Then you will need to copy the Webhook URL. Next, in Lens, you can go to Helm, select Releases, and then click on your Kube Prometheus Stack. In here we will need to update the values of your alertmanager config, more specifically, adding a route and receivers to them like so:
config:
 global: {}
 route:
   receiver: 'slack-notifications'
   group_wait: 30s
   group_interval: 5m
   repeat_interval: 1h
 receivers:
   - name: 'slack-notifications'
     slack_configs:
       - api_url: 'https://hooks.slack.com/services/sdsadsai'  # Your webhook
         send_resolved: true
         title: '{{ .CommonLabels.alertname }} ({{ .Status | toUpper }})'
         text: >-
           {{ range .Alerts }}
           *Alert:* {{ .Labels.alertname }}
           *Severity:* {{ if .Labels.severity }}{{ .Labels.severity }}{{ else }}n/a{{ end }}
           *Node:* {{ if .Labels.node }}{{ .Labels.node }}{{ else }}n/a{{ end }}
           *Namespace:* {{ if .Labels.namespace }}{{ .Labels.namespace }}{{ else }}n/a{{ end }}
           *Summary:* {{ if .Annotations.summary }}{{ .Annotations.summary }}{{ else }}n/a{{ end }}
           *Description:* {{ if .Annotations.description }}{{ .Annotations.description }}{{ else }}n/a{{ end }}
           {{- end }}
Ensure you modify the api_url to your Slack Webhook:
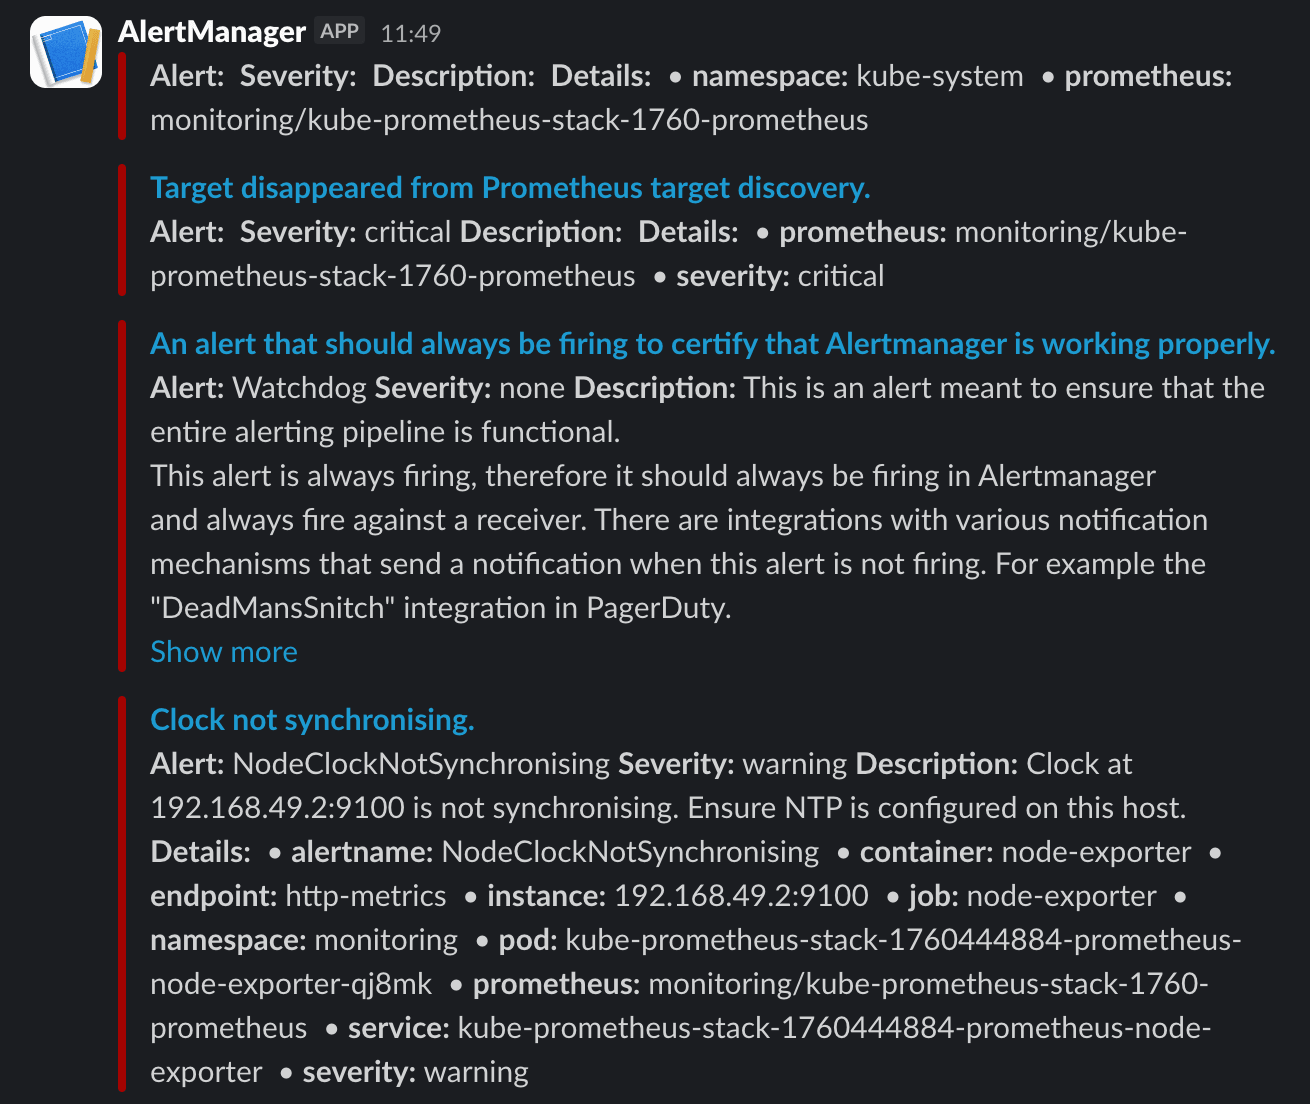
After you click on Save, the helm chart will be redeployed, so you should already receive alerts in your Slack channel:
Creating Custom Prometheus Alert Rules
You can create different alerts based on CPU usage patterns, memory consumption, specific thresholds and even set different time durations.
For example, let’s use this alert that notifies us if we have more than 10 pods on our node. Make sure you change the release name to match your helm release name.
apiVersion: monitoring.coreos.com/v1
kind: PrometheusRule
metadata:
 name: node-pod-count-alert
 namespace: monitoring
 labels:
   release: kube-prometheus-stack-1760444884
spec:
 groups:
   - name: node-pod-count.rules
     rules:
       - alert: HighPodCountOnNode
         expr: count by (node) (kube_pod_info) > 10
         for: 1m
         labels:
           severity: warning
         annotations:
           summary: "High pod count detected on node {{ $labels.node }}"
           description: "Node {{ $labels.node }} is running more than 10 pods for over 1 minute."
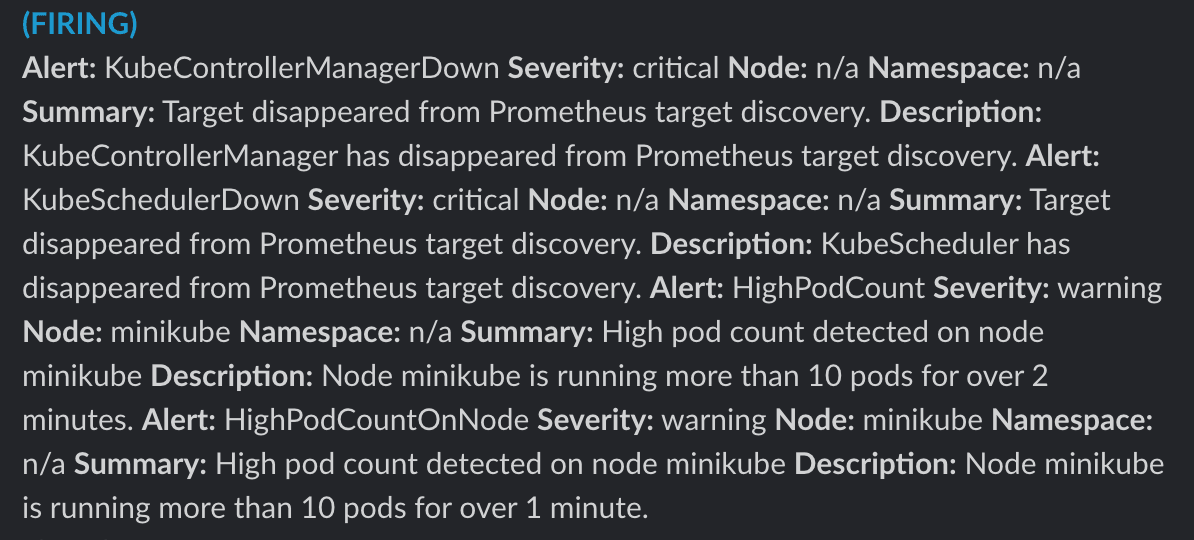
In a couple of minutes, you should see the alert coming into Slack:
Key points
In this article, we’ve walked through how to install Prometheus and Grafana monitoring stack on Minikube, which can be used as a great starting development environment before pushing your changes to superior ones. Pairing everything with Lens Kubernetes IDE offers you the confidence you need to manage your Kubernetes clusters with ease.
In production, you can reuse the same Helm chart, but make sure you are adding persistent storage, and you are exposing Grafana via Ingress or SSO.
As a best practice, even though you might be building your dashboards from the UI, it is a great idea to export them as JSON files and keep them under version control.
If you want to make Kubernetes management a breeze, download Lens Kubernetes IDE today.