The Most Common Kubernetes Errors and How to Fix Them
Managing Kubernetes (K8s) at scale can easily transform into a cumbersome process. There are many issues that can arise, which can be hard to solve, especially if you don't know where to look, or you haven’t faced them before.
Even if you’ve seen these errors in the past, solving them can have different solutions, depending on their source: pod scheduling, container runtime issues, misconfigured manifests, network policies, and others.
In this article, we will take a look at what are the most common K8s errors, and how easy it is to fix them with Lens, and Lens Prism.
What are the most common Kubernetes Errors?
Let’s explore an overview of what are the most common errors, and their most common solutions. You will see that there are many different solutions you will need to try for these errors, thus making the debugging process hard.
There is however, a formula that can be always used for debugging K8s issues when they are related to pods. You should always try to:
- Use
kubectl describeto understand what is happening with your pod - Check the pod logs
- Verify the pod manifest
TL;DR? Check out the video instead:
1. CrashLoopBackoff
CrashLoopBackoff means that a pod is repeatedly crashing during startup and it is being restarted by the kubelet. There are many reasons for why this can happen, and some of the most common ones include:
- Misconfigured command or entrypoint
- Resource limits for CPU or Memory are too low
- Pods may be trying to use non-existent resources
- Missing environment variables or config files
- Application error causing the container to exit
- Containers might fail on missing file permissions
- Incompatible base images
- Database readiness is not ensured before the application starts
This is how a pod with this status would look like in the CLI:
kubectl get pods
NAME READY STATUS RESTARTS AGE
instant-crash-pod 0/1 CrashLoopBackOff 4 (65s ago) 2m44s
There are many other reasons for why CrashLoopBackoff may occur, so in order to fix it, you will need to investigate a couple of things.
The first step you will need to do is to run kubectl describe on the failed pod to inspect the events that have happened during the creation of the pod. Depending if the pod is deployed as part of a deployment/statefulset/replicaset/daemonset/standalone you will need to run the appropriate kubectl describe command.
Example output for a describe command for a pod that is in the CrashLoopBackoff state:
Events:
Type Reason Age From Message
---- ------ ---- ---- -------
Normal Scheduled 3m43s default-scheduler Successfully assigned default/instant-crash-pod to lens-kind-control-plane
Normal Pulled 3m43s kubelet Successfully pulled image "busybox" in 935ms (935ms including waiting).
Normal Pulled 3m41s kubelet Successfully pulled image "busybox" in 1.067s (1.067s including waiting).
Normal Pulled 3m24s kubelet Successfully pulled image "busybox" in 965ms (965ms including waiting).
Normal Pulled 2m59s kubelet Successfully pulled image "busybox" in 1.069s (1.069s including waiting).
Normal Pulled 2m5s kubelet Successfully pulled image "busybox" in 1.171s (1.171s including waiting).
Normal Pulling 37s (x6 over 3m44s) kubelet Pulling image "busybox"
Normal Created 35s (x6 over 3m43s) kubelet Created container: crash
Normal Started 35s (x6 over 3m43s) kubelet Started container crash
Normal Pulled 35s kubelet Successfully pulled image "busybox" in 1.129s (1.129s including waiting).
Warning BackOff 11s (x18 over 3m40s) kubelet Back-off restarting failed container crash in pod instant-crash-pod_default
After you get a sense of what is happening using kubectl describe, it is now time to check the pod logs and try to understand why the pod is failing. If your pod has dependencies, make sure you use initContainers to delay the creation of the main one, until dependencies are up. At the same time, if you see errors related to liveness and readiness probes, modify their timing or temporarily disable them to verify if they’re the issue.
Your pod might be also entering the CrashLoopBackoff state if there are issues with memory limits, so ensure that your limits are big enough for the pod to be created.
2. ErrImagePull/ImagePullBackOff
ErrImagePull is one of the most common Kubernetes errors you will encounter, and this is happening when your cluster cannot pull a container image required by your pods.
This error can happen for several reasons such as:
- Using an incorrect image name or tag
- Private registry access denied
- Image doesn’t exist anymore
- Rate limits
- Pod doesn’t have permission to access the image
Kubernetes will initially show the ErrImagePull, but after retrying multiple times, it will end up with the ImagePullBackOff error. After each image pull retry, the delay between scheduling a new download attempt increases.
To fix this issue, you should first check your pod specification and see if it provides the correct image/registry. You can use docker pull image_name, to verify if the image can be pulled.
In case you are using private registries, make sure you create the necessary pull secret for that particular registry, and ensure this is attached to your pod in the imagePullSecrets.
imagePullSecrets:
  - name: registry_secret_name
3. CreateContainerError / CreateContainerConfigError
Both CreateContainerError and CreateContainerConfigError, are common error messages you might encounter when you are deploying resources inside your Kubernetes clusters.
These errors happen before a container starts, but they have different root causes.
CreateContainerError typically occurs when:
- There is a bad command or entrypoint, or they are missing altogether
- There is naming conflict
- The container tries to run an executable file without execute permissions
- A file or binary expected in the image doesn’t exist
- There are inaccessible storage volumes
CreateContainerConfigError typically occurs when:
- There is a missing ConfigMap or a Secret
- You reference a key that doesn’t exist in a Secret or ConfigMap
When facing the CreateContainerError, you should check the container’s events by using the describe command, understand what the Failed event is, and troubleshoot the issue.
On the other hand, when you are facing the CreateContainerConfigError, after following the same steps, you will usually see that your pod couldn’t find a particular ConfigMap, Secret, or a key in the Configmap or Secret. As soon as you identify the issue, you should modify the Pod manifest and reapply it.
4. OOMKilled
The OOMKilled error happens when a container is killed because it was using more memory than it was allowed.
Here are some common causes for why this happens:
- There are no memory limits set, or they are too low
- There is an in-app memory spike or leak
- JVM app over-allocates heap
- Large buffers or in-memory caches
After using kubectl describe to view all the relevant events from your pod, you should always use the kubectl top pod command to understand the pod’s memory usage. In case there are no spikes or memory leaks, it is safe to assume that your app consumes more memory than it has allocated, so you need to increase the limits:
resources:
  requests:
    memory: "128Mi"
  limits:
    memory: "256Mi"
You should also ensure that your node has enough resources to handle your workloads, and in some cases, you can also refactor your application to reduce memory consumption.
5. NodeNotReady
Nodes can be in different states such as Ready (when it is healthy and capable of accepting new pods), Not Ready (when it has issues, and it is not functioning properly), and Unknown (usually this happens when there are communication issues with the node).
The NodeNotReady error typically means that your node cannot run new pods.
Some of the common causes for why this happens include:
- Resource pressure such as low disk space or memory exhaustion
- Issues with the kubelet
- Issues with kube-proxy
- Network problems
To understand what is happening you should check the node status and conditions:
kubectl describe node <node-name>
Another thing you should do is connect to the node, and see the kubelet logs, as this will give you more insights:
journalctl -u kubelet
In addition to this, you should try to verify there are no network problems, and that kube-proxy is running properly.
6. Unschedulable Pods: FailedScheduling
This error means that a pod is stuck in a Pending state, because Kubernetes cannot assign it to any node.
Here are some of the most common causes for why this happens:
- Insufficient cluster resources
- Node taints without matching tolerations
- Affinity or node selector rules are overly restrictive
- Nodes are cordoned or drained
To troubleshoot you should first use the describe command on the Pod to see if there are any scheduling errors (look for FailedScheduling) events.
Some other actions you can do include:
- Using describe commands on the node to check resource usage
- Review taints and tolerations
- Adjust affinity rules
- Uncordon your node
7. Readiness/Liveness Probe Failures
Configuring probes to test your application is a best practice when it comes to using Kubernetes. The liveness and readiness probes are very important, but when you set them up, you will most likely start facing a new set of errors:
- Your applications might not be ready during the probe windows
- You have configured a wrong path or port
To fix errors related to these probes, you should verify your manifests and ensure your applications have enough time to be ready before the probe windows, and also double check your paths and your ports.
You can also port-forward your applications and test them manually to ensure everything is working properly.
8. PodInitializing Error
If your init container fails or crashes, your main container will not start and the pod will be stuck in the PodInitialization state.
The init container can fail for many reasons, from the list described above, so to ensure a smooth debugging process, you should first try to identify what is the case in which your init container is, and follow the debugging process accordingly.
Your troubleshooting checklist should like this:
- Describe the pod and review the init container events
- Try to view the init logs if that’s possible
- Understand what the error is, and start implementing one of the fixes
How can Lens The Kubernetes IDE help you solve these issues?
Lens K8s IDE equips you with everything you need to connect, observe, and manage your Kubernetes clusters. It is a developer product meant to complement kubectl and observability platforms.
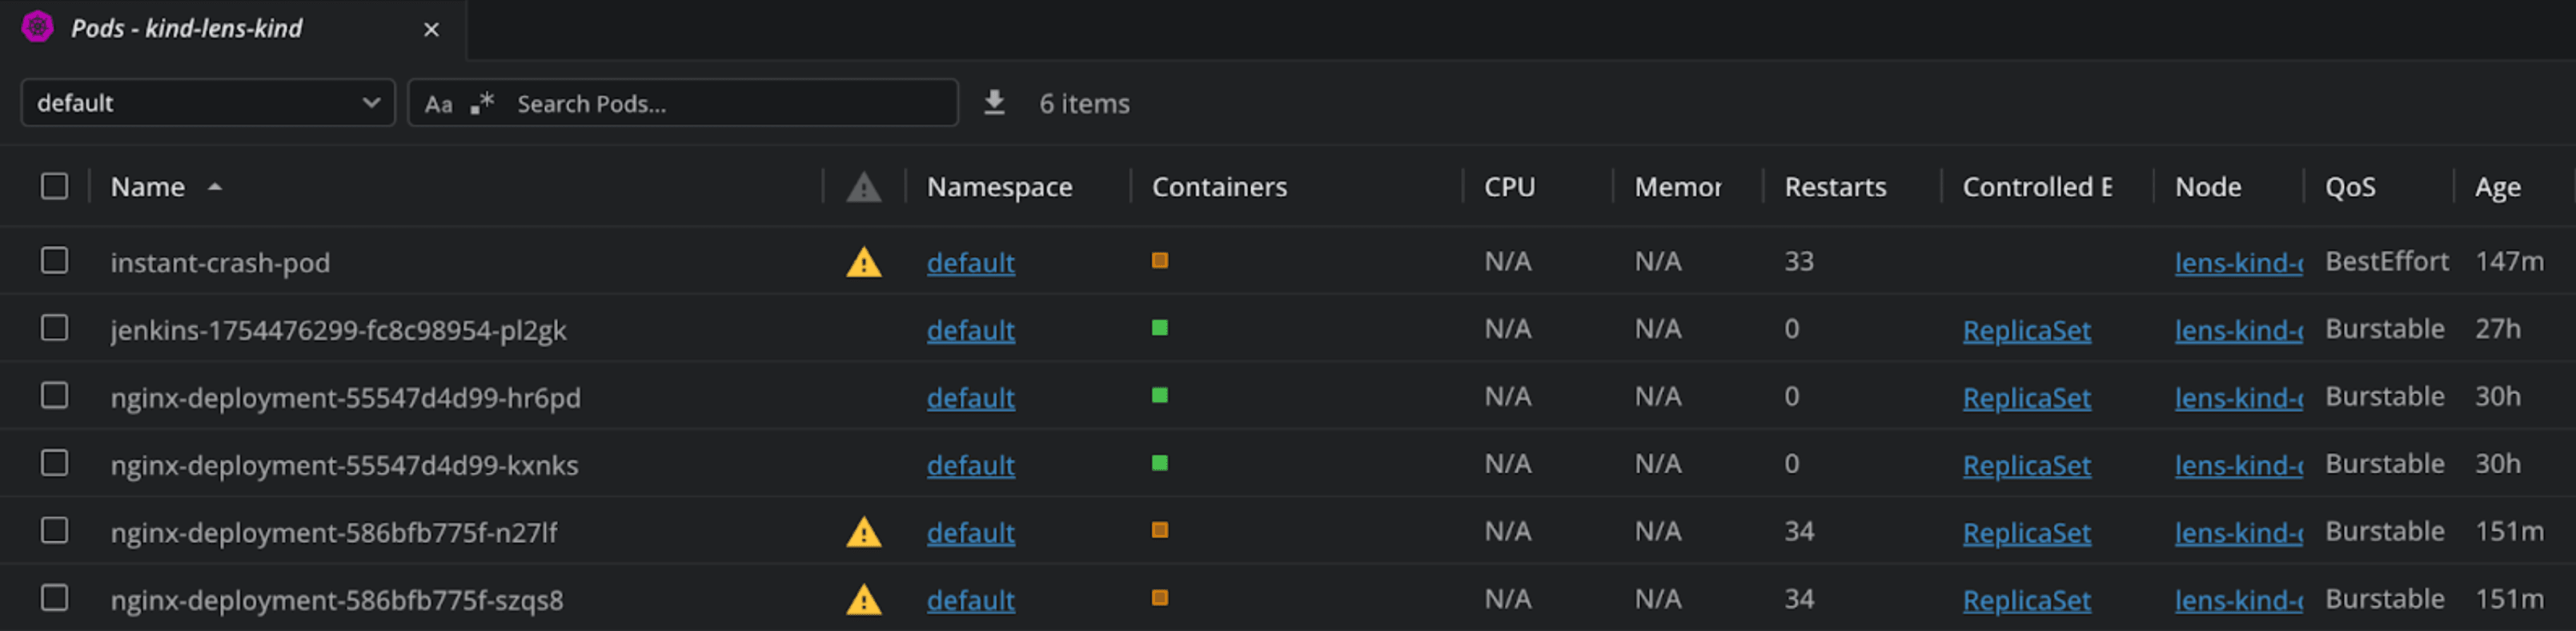
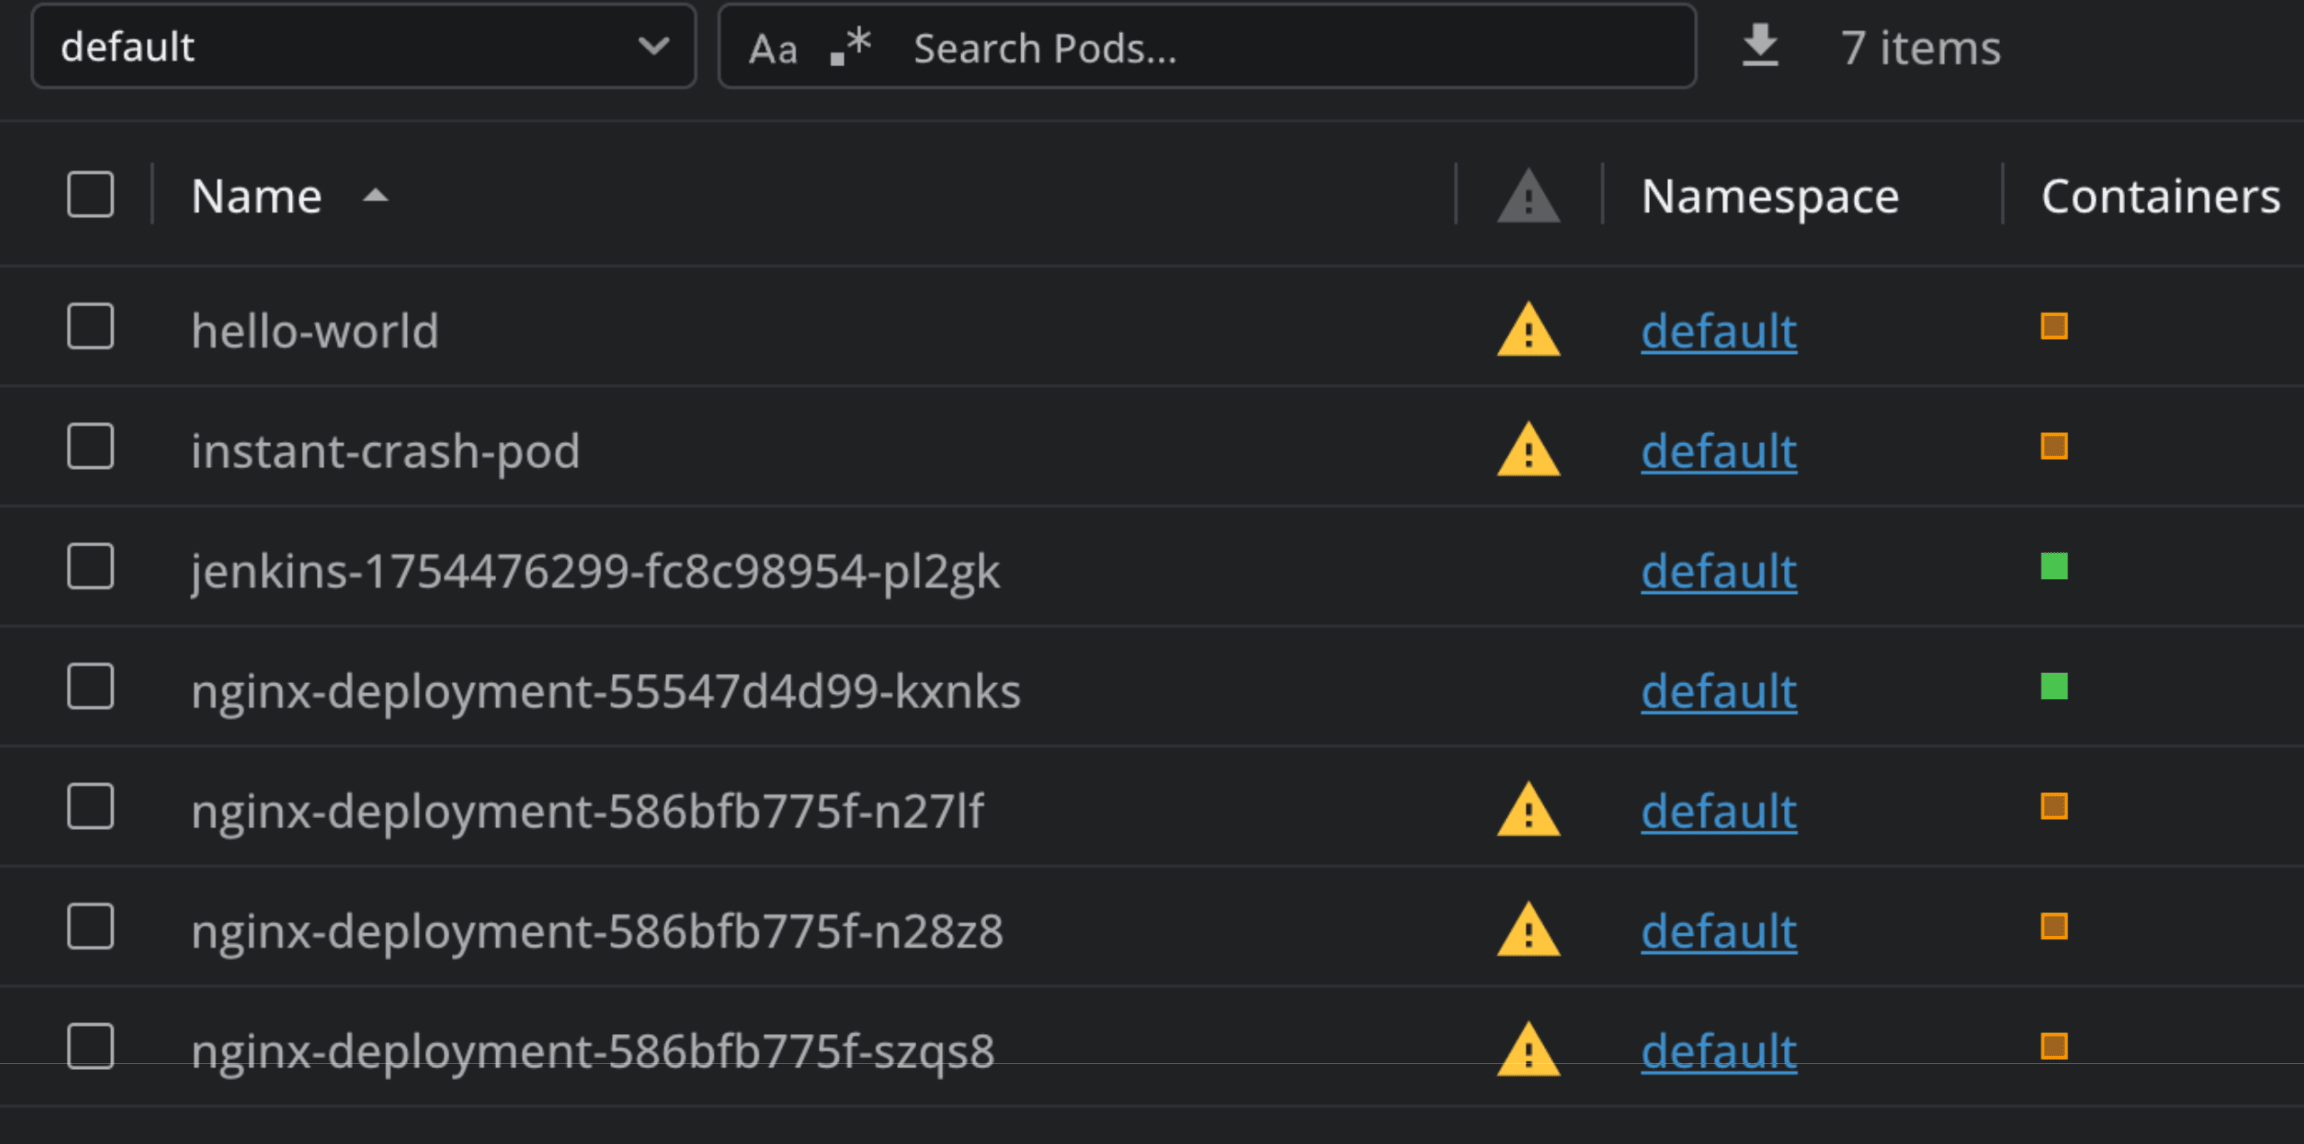
In Lens K8s IDE, you can see at a glance what are the pods that have issues by checking for the yellow triangle in the Pods view.
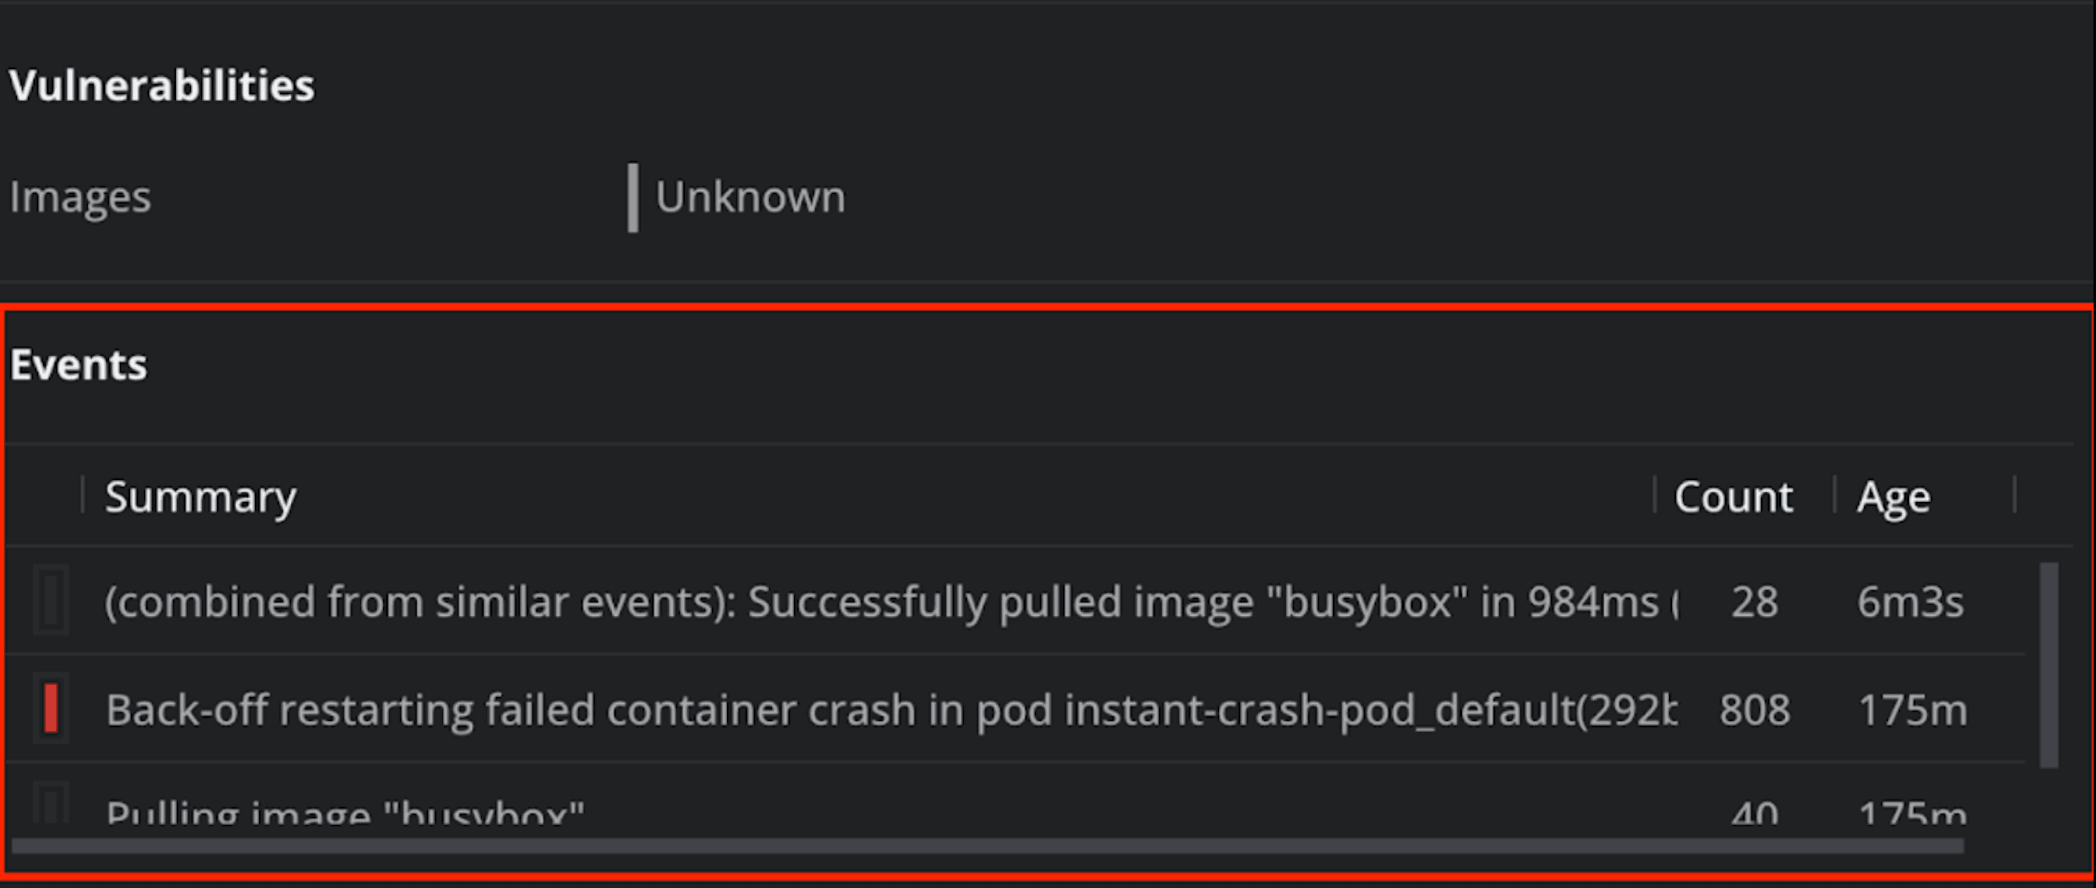
By clicking on any of the pods, and scrolling down to events, you can easily understand what is the issue with your pod:
Lens K8s IDE also gives you an easy way to connect to the pod shell or attach to the pod, and you can also get the logs without needing to type any kubectl commands.
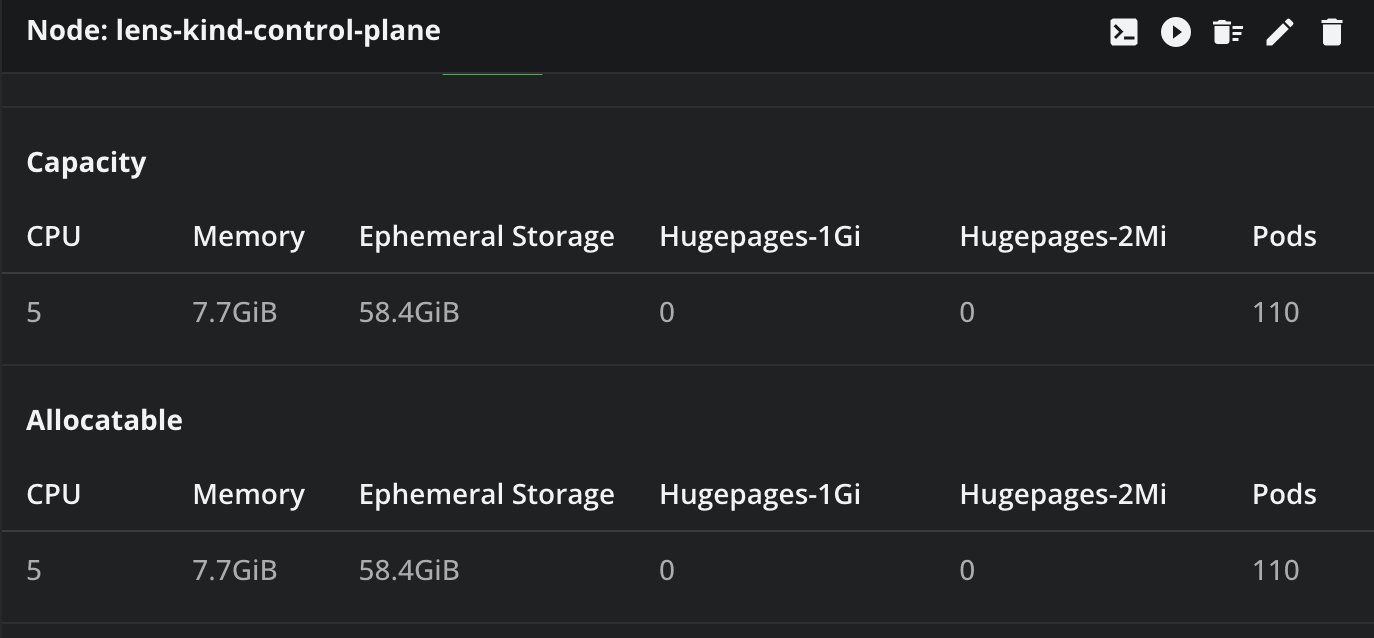
For node related issues, you can easily see all your nodes, and details about their health, resource allocations, how many pods they are hosting and more.
If you want to see what other things you can do with Lens K8s IDE, check out this article.
Even if this speeds up your debugging process a lot when compared to plain kubectl, we wanted to take it up a notch, and that's why we’ve introduced Lens Prism.
What is Lens Prism and how can it help with the most common Kubernetes Errors?
Lens Prism is an AI-Powered Kubernetes Copilot accessible directly from Lens K8s IDE. It connects to OpenAI compatible LLM and it can help you understand what is happening inside of your Kubernetes clusters, making the debugging process easier.
For this example I will use an OpenAI API key, and leverage GPT 4.1 to get solutions for the issues inside my cluster.
Let’s see it in action:
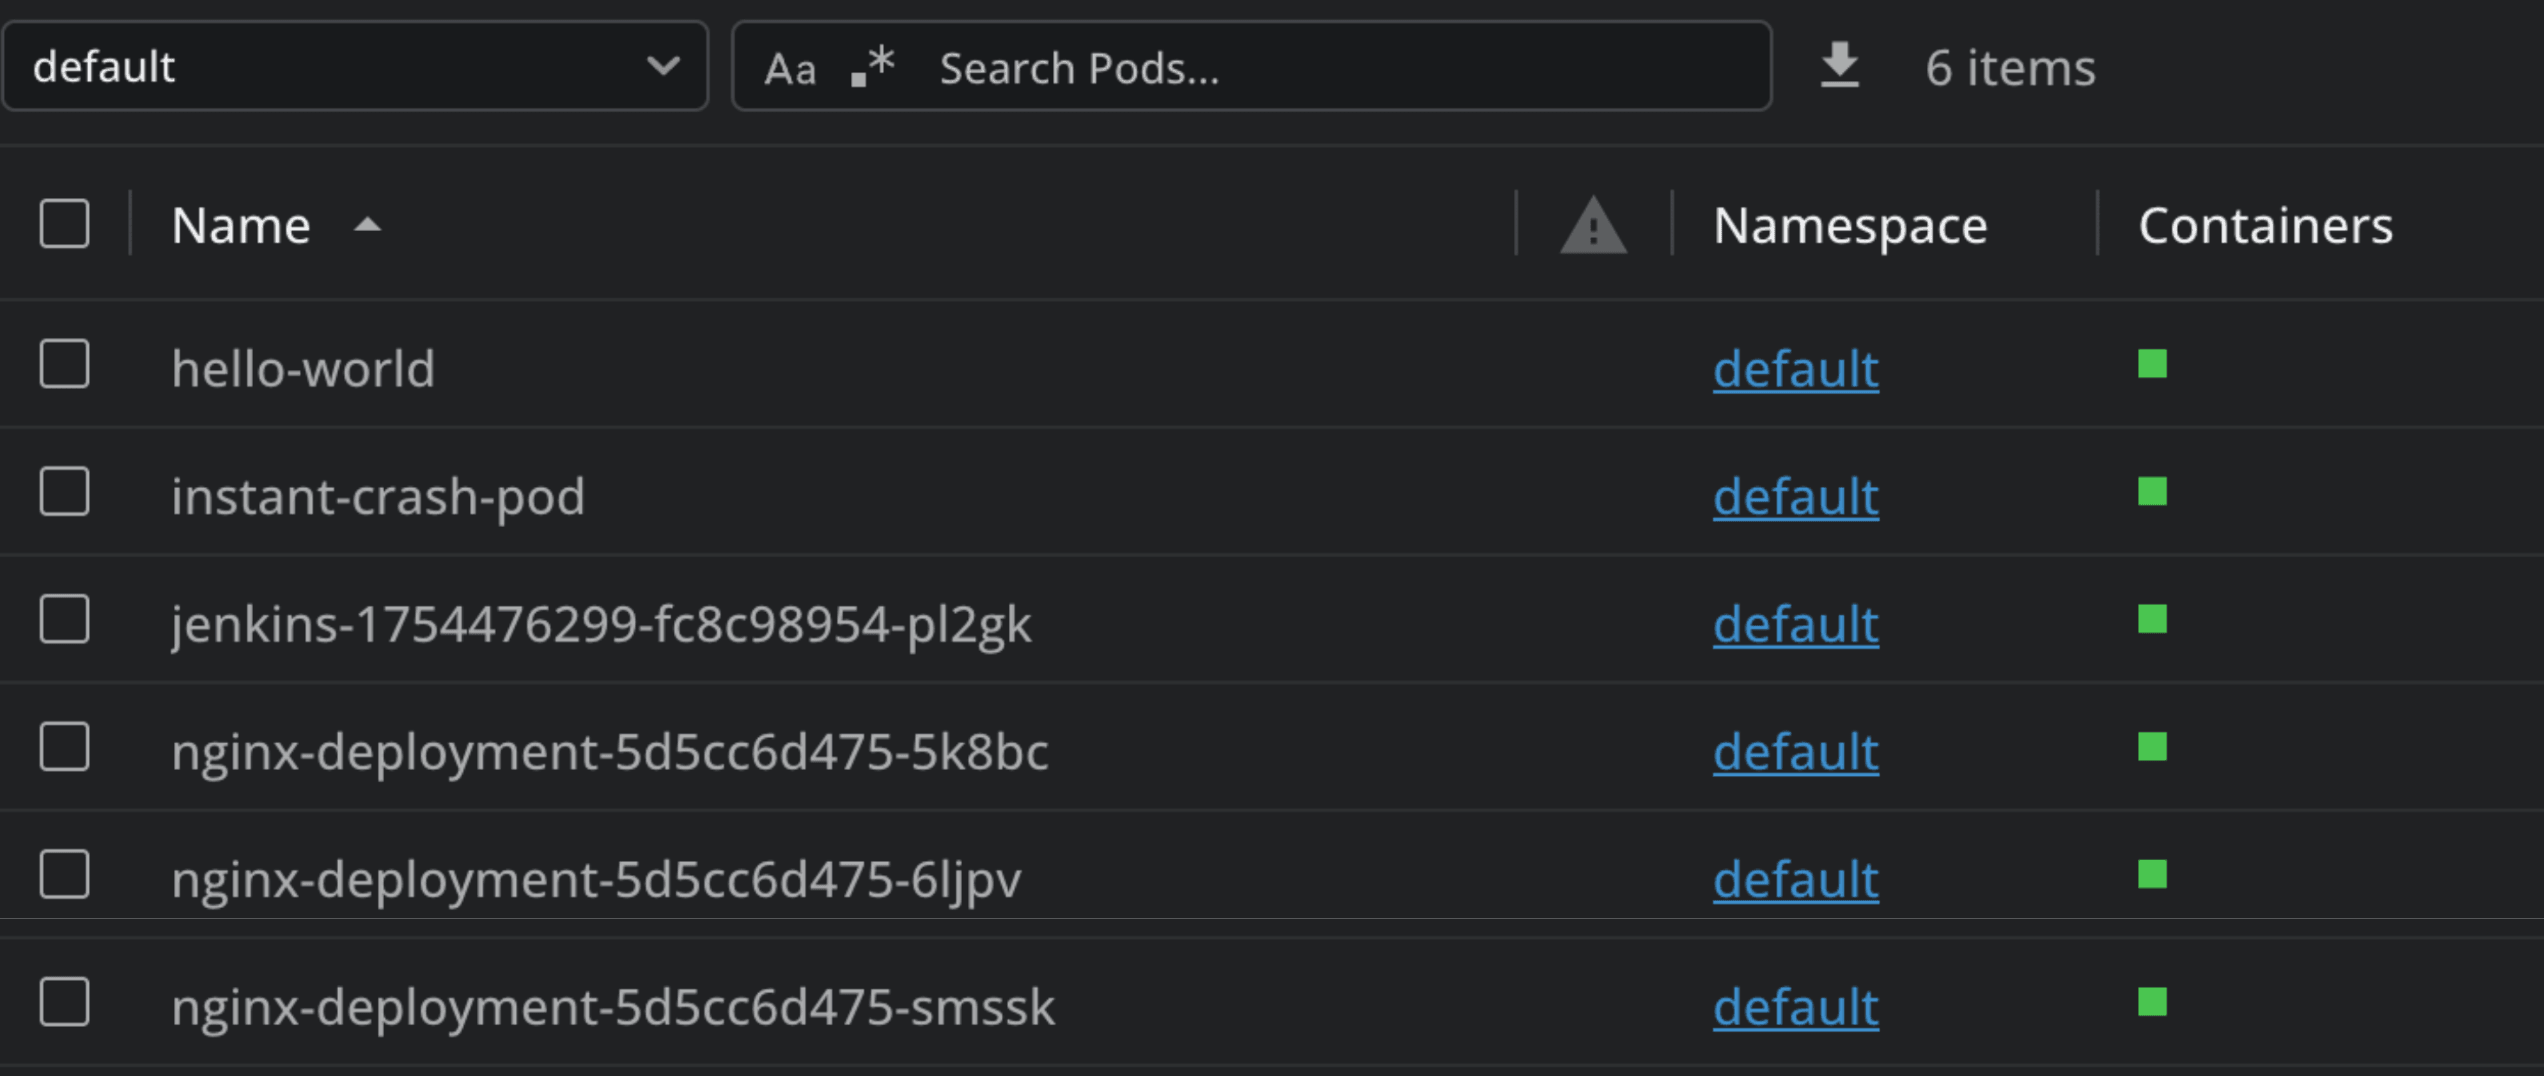
In the above example, you can see I have many pods that are in an unhealthy state. I will now go into my Lens Prism chat, and ask what is happening with my pods:
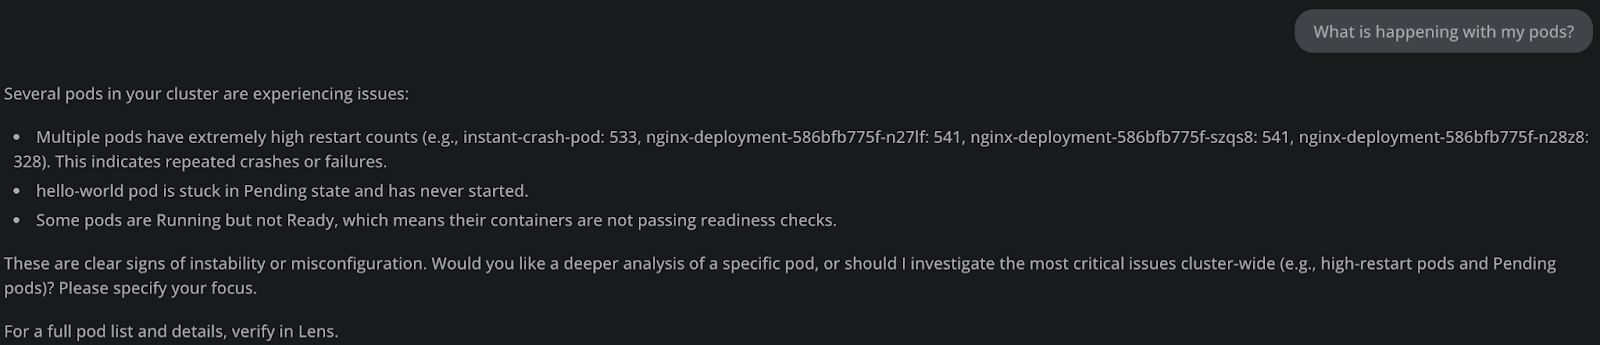
We can easily see a list of all the pods that have issues in the chat, but now lets dig even deeper into their root causes and how to solve them:
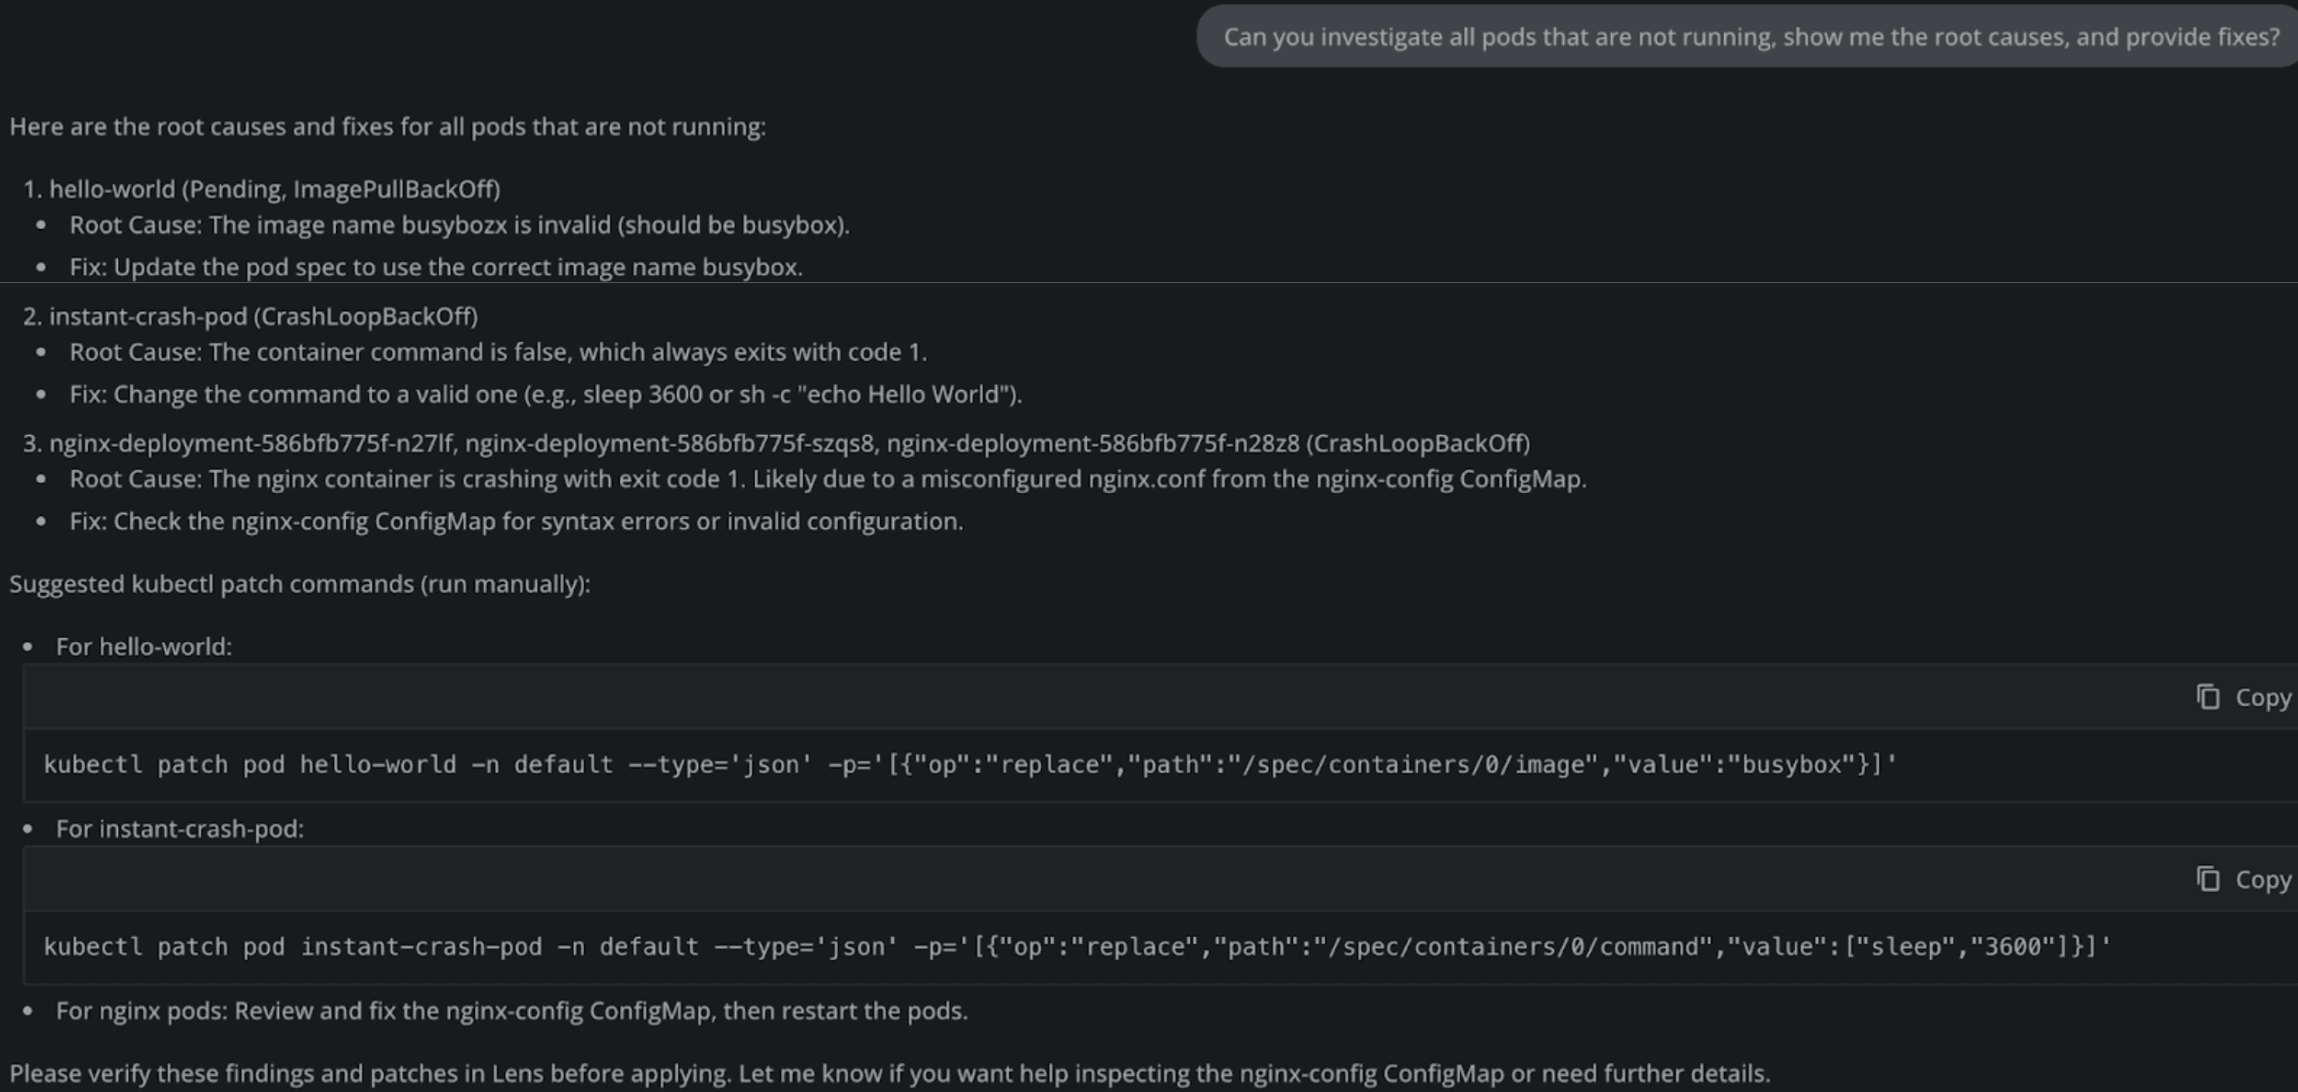
We get a list of potential fixes for all of our containers. Let’s apply the patches mentioned above and see if this solves are issues for the first two pods:
kubectl patch pod hello-world -n default --type='json' -p='[{"op":"replace","path":"/spec/containers/0/image", "value":"busybox"}]'
pod/hello-world patched
The hello-world pod was patched successfully and the issue has disappeared.
For the second case related to the instant-crash-pod, we are trying to patch a command, and this is forbidden in Kubernetes:
kubectl patch pod instant-crash-pod -n default --type='json'...
The Pod "instant-crash-pod" is invalid: spec: Forbidden: pod updates may not change fields other than ...
But if we go back to what Lens Prism told us initially, we understand that the command we are using is invalid one, so what we can do is modify the manifest, delete the pod and recreate it. As soon as we do that we can see that it is working as expected.
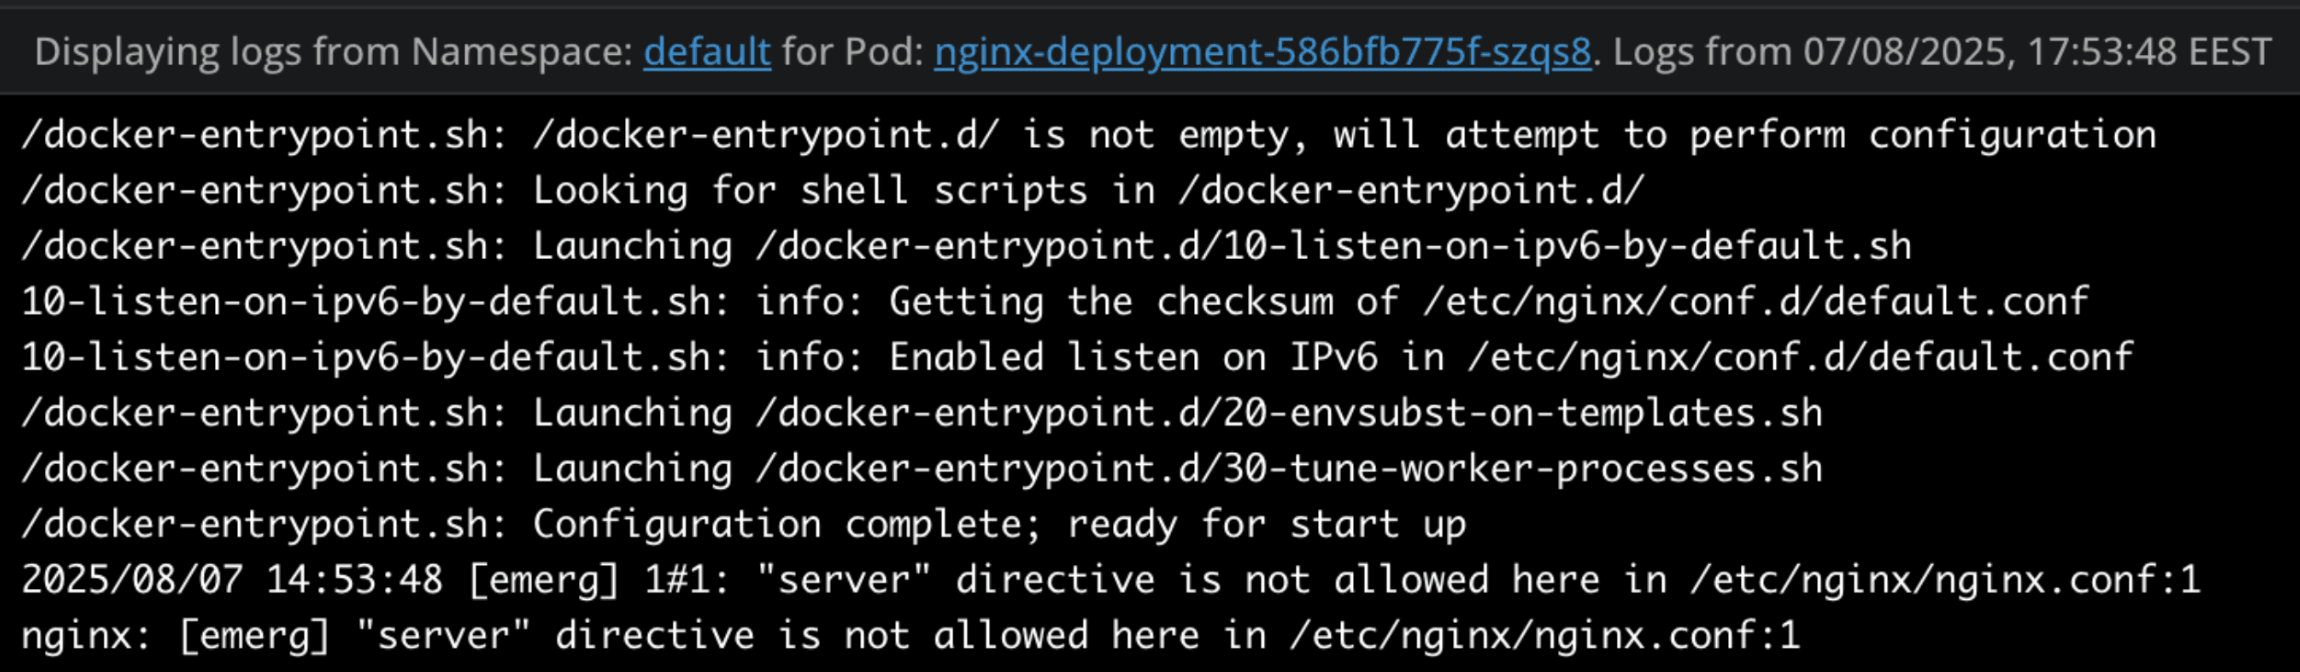
Now let’s deep dive into what is happening with nginx. For that I will ask a follow up question:
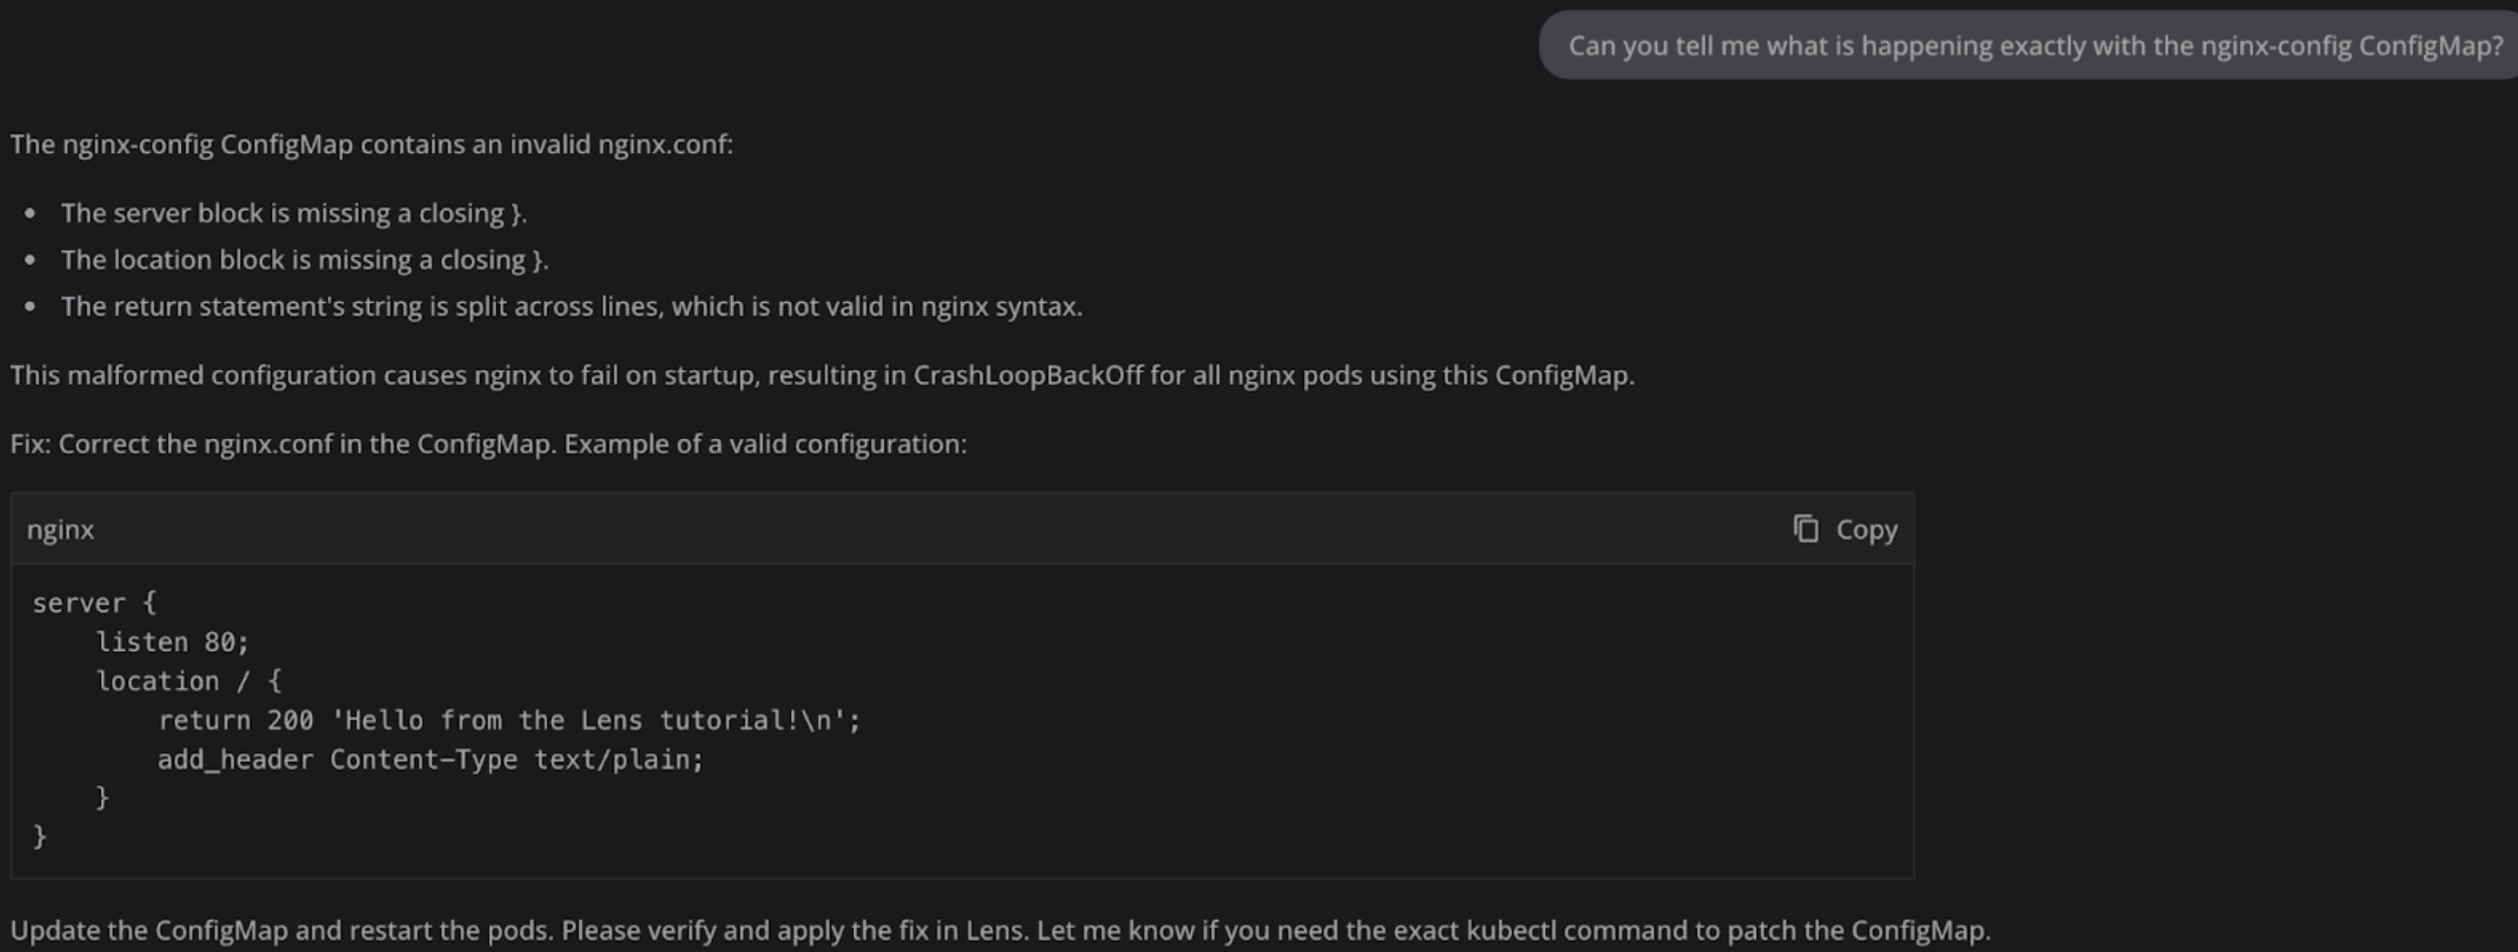
So it’s clear that our ConfigMap has some issues, let’s fix them as Lens Prism told us and see what is happening. After applying the fix, we are still facing errors because the server directive doesn’t exist on its own in nginx.conf.
Let’s tell Lens Prism that, and see if it comes up with a better solution:
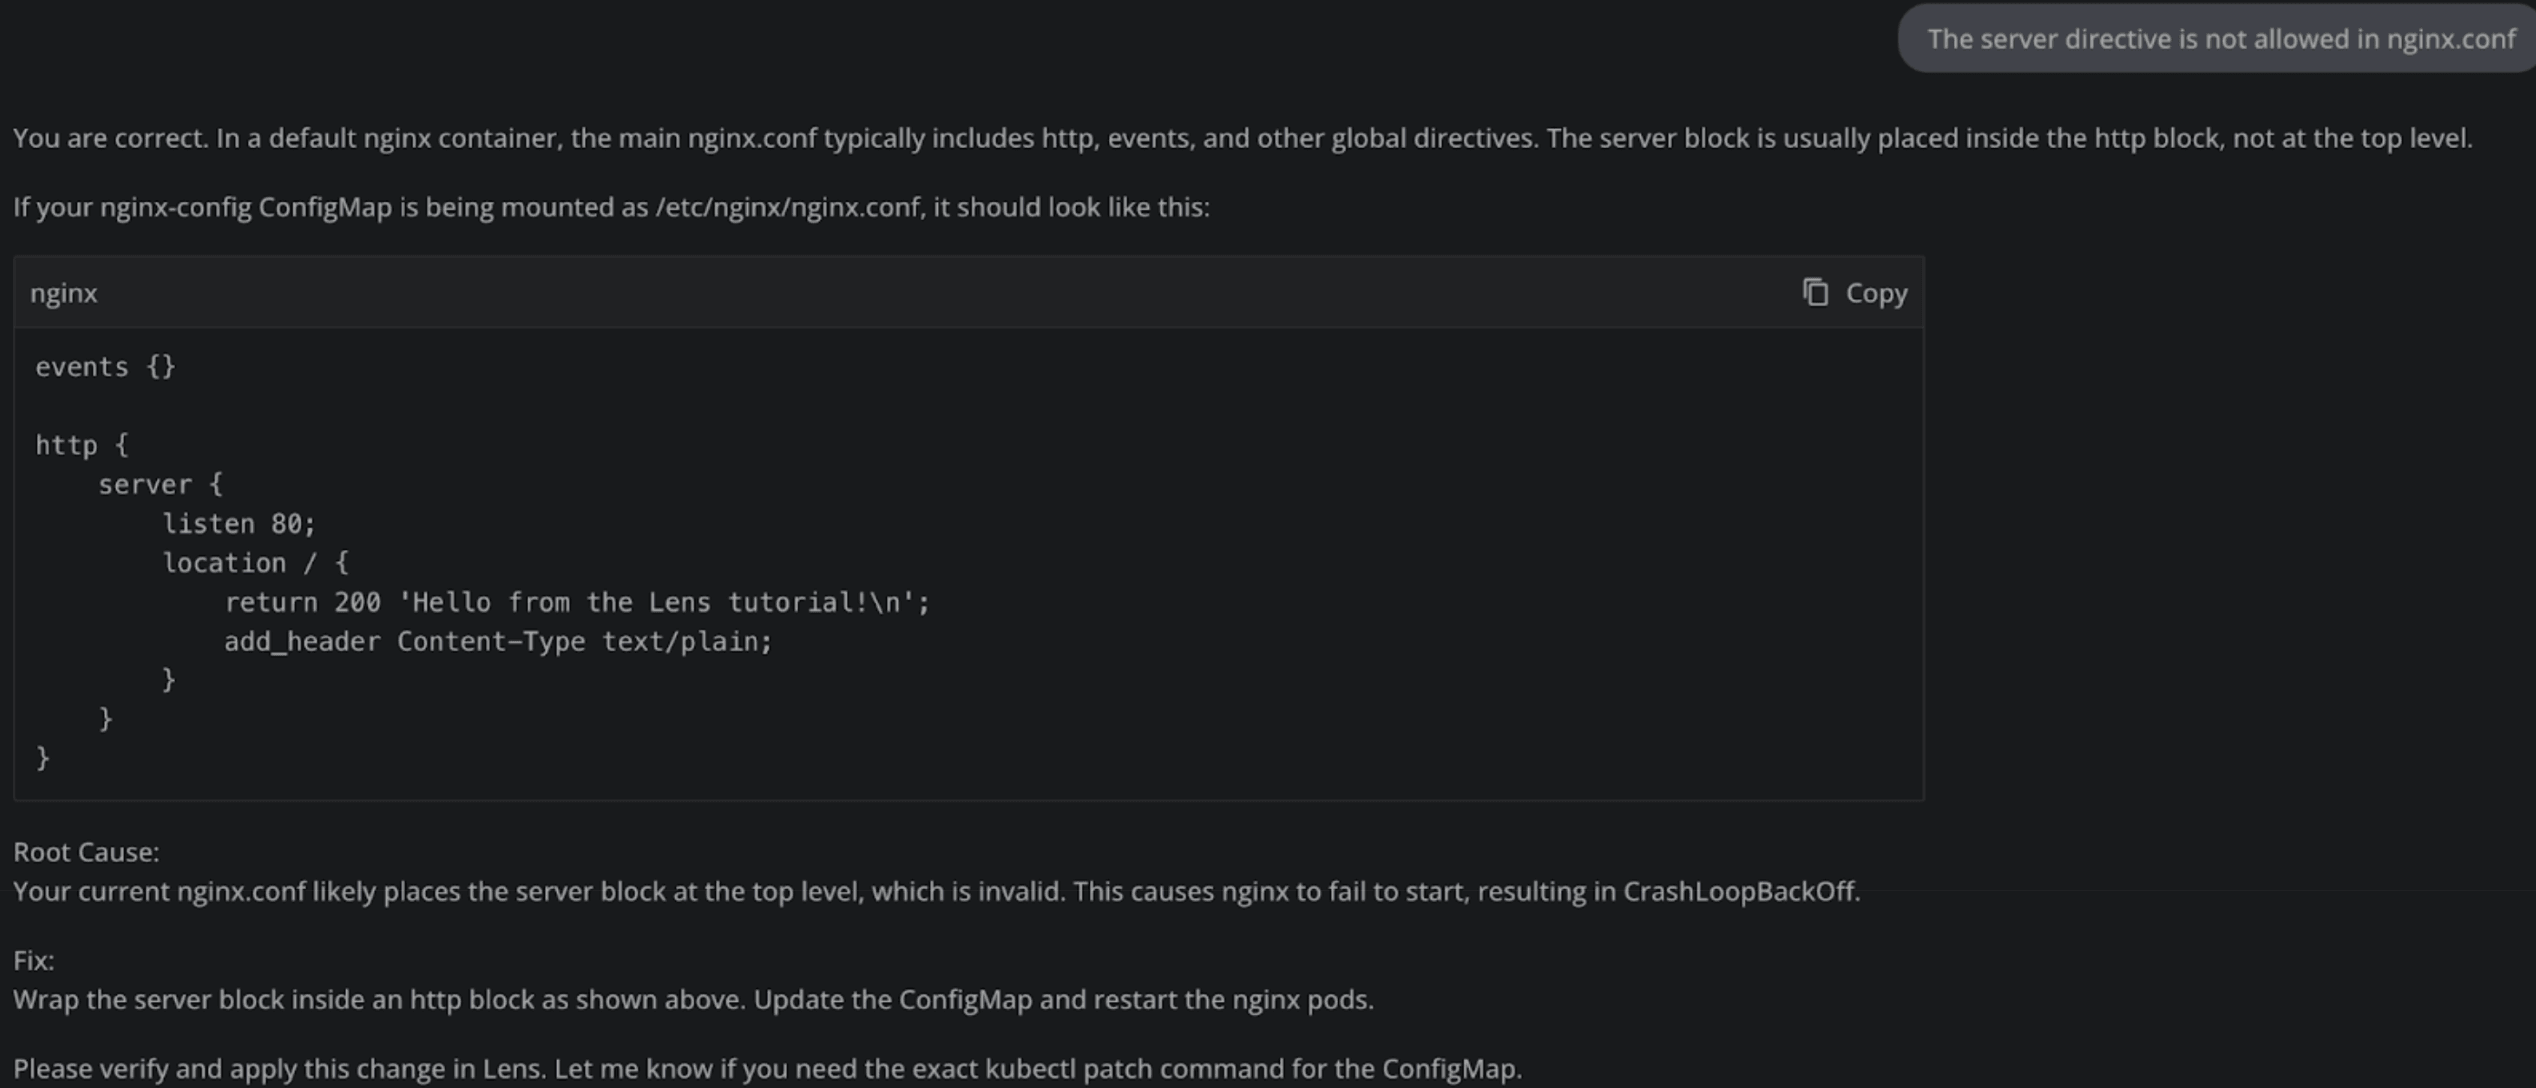
After applying this fix and restarting my nginx deployment, I see that all of my pods are running successfully:
Lens Prism sped up our debugging time considerably, and using at scale will help us solve many issues our Kubernetes resources will face. Because it is integrating with LLMs, you should always be mindful that fixes it provides may not always work on the first try, and that’s to be expected.
Whenever a fix doesn’t work, continue chatting with Lens Prism, because it supports multi-turn conversational queries, meaning that you can also ask follow-up questions, making your debugging process easier.
Note: Lens Prism is available starting from the Plus/Pro tiers. To learn more about our pricing click here.
For more information about Lens Prism, check out this article.
Key points
In this article we’ve:
- Went through the most common K8s errors
- CrashLoopBackoff
- ErrImagePull/ImagePullBackOff
- CreateContainerError / CreateContainerConfigError
- OOMKilled
- NodeNotReady
- Unschedulable Pods: FailedScheduling
- Readiness/Liveness Probe Failures
- PodInitializing Error
- Saw the many ways we can solve these issues
- Went through how Lens K8s IDE speeds up the debugging process
- Understood how Lens Prism takes debugging to the next level
Knowing what to do when you are facing the most common Kubernetes errors saves you a lot of time, but as you saw throughout this article, there are many possible solutions to them.
Leveraging Lens K8s IDE and Lens Prism will help you a lot with your debugging process, and will equip you with all the tools you need for ensuring that your workloads are running smoothly inside of Kubernetes.
If you want to see Lens K8s IDE and Lens Prism in action, download it today.