Lens Kubernetes IDE Overview: How to simplify Kubernetes Management
Managing Kubernetes (K8s) clusters, especially when you do it at scale, can be an overwhelming process. Imagine having over 20 K8s clusters: you will need to use kubectl, dashboards, and jump between contexts, just to understand what is happening inside of them. Debugging issues and investigating workloads at scale, soon becomes a cognitive overload, even for the most experienced engineers.
This is where Lens – The Kubernetes IDE steps in, removing the friction between memorizing debugging commands across multiple clusters, switching between them, and always remembering what are the resource relationships inside of your K8s clusters.
Lens K8s IDE offers a visual and real-time interface for your clusters that you can leverage at scale, simplifying daily tasks like troubleshooting, monitoring health, and inspecting resources.
In this post, we will explore:
- What is Lens K8S IDE
- Why use Lens K8S IDE
- How to install and setup Lens K8S IDE
- Navigating the Lens K8S IDE interface
- How to use the AWS EKS one click integration to Lens K8S IDE
- Lens Prism: AI-Powered Kubernetes Copilot
- Lens K8S IDE pricing
TL;DR?
1. Lens K8s IDE is the most popular K8s IDE that gives you an easy way to manage your K8s workflows, enabling you to understand what happens inside your clusters.
2. You should use Lens K8s IDE because it offers you a visual cluster exploration, with a context aware navigation, has a built-in terminal, offers Helm support, CRD support, native integration with AWS EKS, AI debugging through Lens Prism, CVE reporting, and more.
3. Lens K8s IDE interface gives you the ability to understand what is happening with your Nodes, Pods, Deployments, ReplicaSets, StatefulSets, DaemonSets, ConfigMaps, Secrets, CRDs, Helm releases, and more. The insights you get are invaluable, and the fact that you can edit everything on the fly, without using kubectl, makes the process easy.
4. With Lens K8s IDE you can easily connect to your AWS EKS clusters using a one-click integration. As soon as you enable the integration, all the EKS clusters you have access to, will be automatically available in Lens K8s IDE.
5. Lens Prism is Lens K8s IDE’s AI copilot that can help you easily understand what is happening inside your clusters, see why workloads failed, and provides solutions for how to fix them.
6. Lens K8s IDE has multiple pricing options that scale with your needs. You can use Lens K8s IDE either as an individual or as an organization, ensuring that your requirements are met regardless of where you are.
Check out the video to see the majority of the features in action, or continue reading to understand more about what you can do with Lens K8s IDE:
What is Lens K8S IDE?
Lens K8S IDE is the most popular Kubernetes IDE that lets you connect to, observe, and manage Kubernetes clusters in a clean, and graphical environment. It doesn’t replace kubectl, but complements it, making it easy for users to stop switching between multiple K8s clusters, and memorizing their configurations.
With Lens K8S IDE you get multi-cluster visibility in a single product, letting you take control of your Kubernetes clusters, without needing to run any kubectl command.
Lens K8S IDE gives you an easy mechanism to:
- View logs
- Connect to different pods
- View configmap and secret details
- Port-forward to your services
- Real-time resource monitoring
- And much more
Why use Lens K8S IDE?
Before diving into how to install and configure Lens K8s IDE, let’s answer one of the most important questions: Why Lens K8S IDE?
Lens K8S IDE supports your software developers, operators, and administrators, by providing a powerful UI that’s accessible for any skill level.
Lens K8S IDE offers:
- Visual cluster exploration: you can easily view all Kubernetes resources such as pods, nodes, services, deployments, at a glance
- Context-aware navigation: switch between clusters and namespaces
- Built-in terminal: easily execute
kubectlcommands without leaving the app - Live resource monitoring: you get real-time status updates for pods, CPU/memory usage, logs, and events
- Helm support: discover, install, and manage Helm charts without needing to run many helm commands
- Lens Teamwork: support role-based access control (RBAC) for spaces and connected clusters
- Metrics dashboard: get Grafana-style visualizations without extra setup
- CRD support: view all your CRDs and understand what you can do with them
- Native integration with AWS EKS: one click connection to your AWS EKS clusters, based on your level of permissions
- AI debugging: Lens Prism helps you understand what is happening in your K8s clusters, and provides meaningful insights
- CVE reporting: view vulnerabilities in container images, roles, and Kubernetes resources
- Single Sign-On (SSO): implement SSO with SAML or OIDC
- And more
How to install and set up Lens K8S IDE?
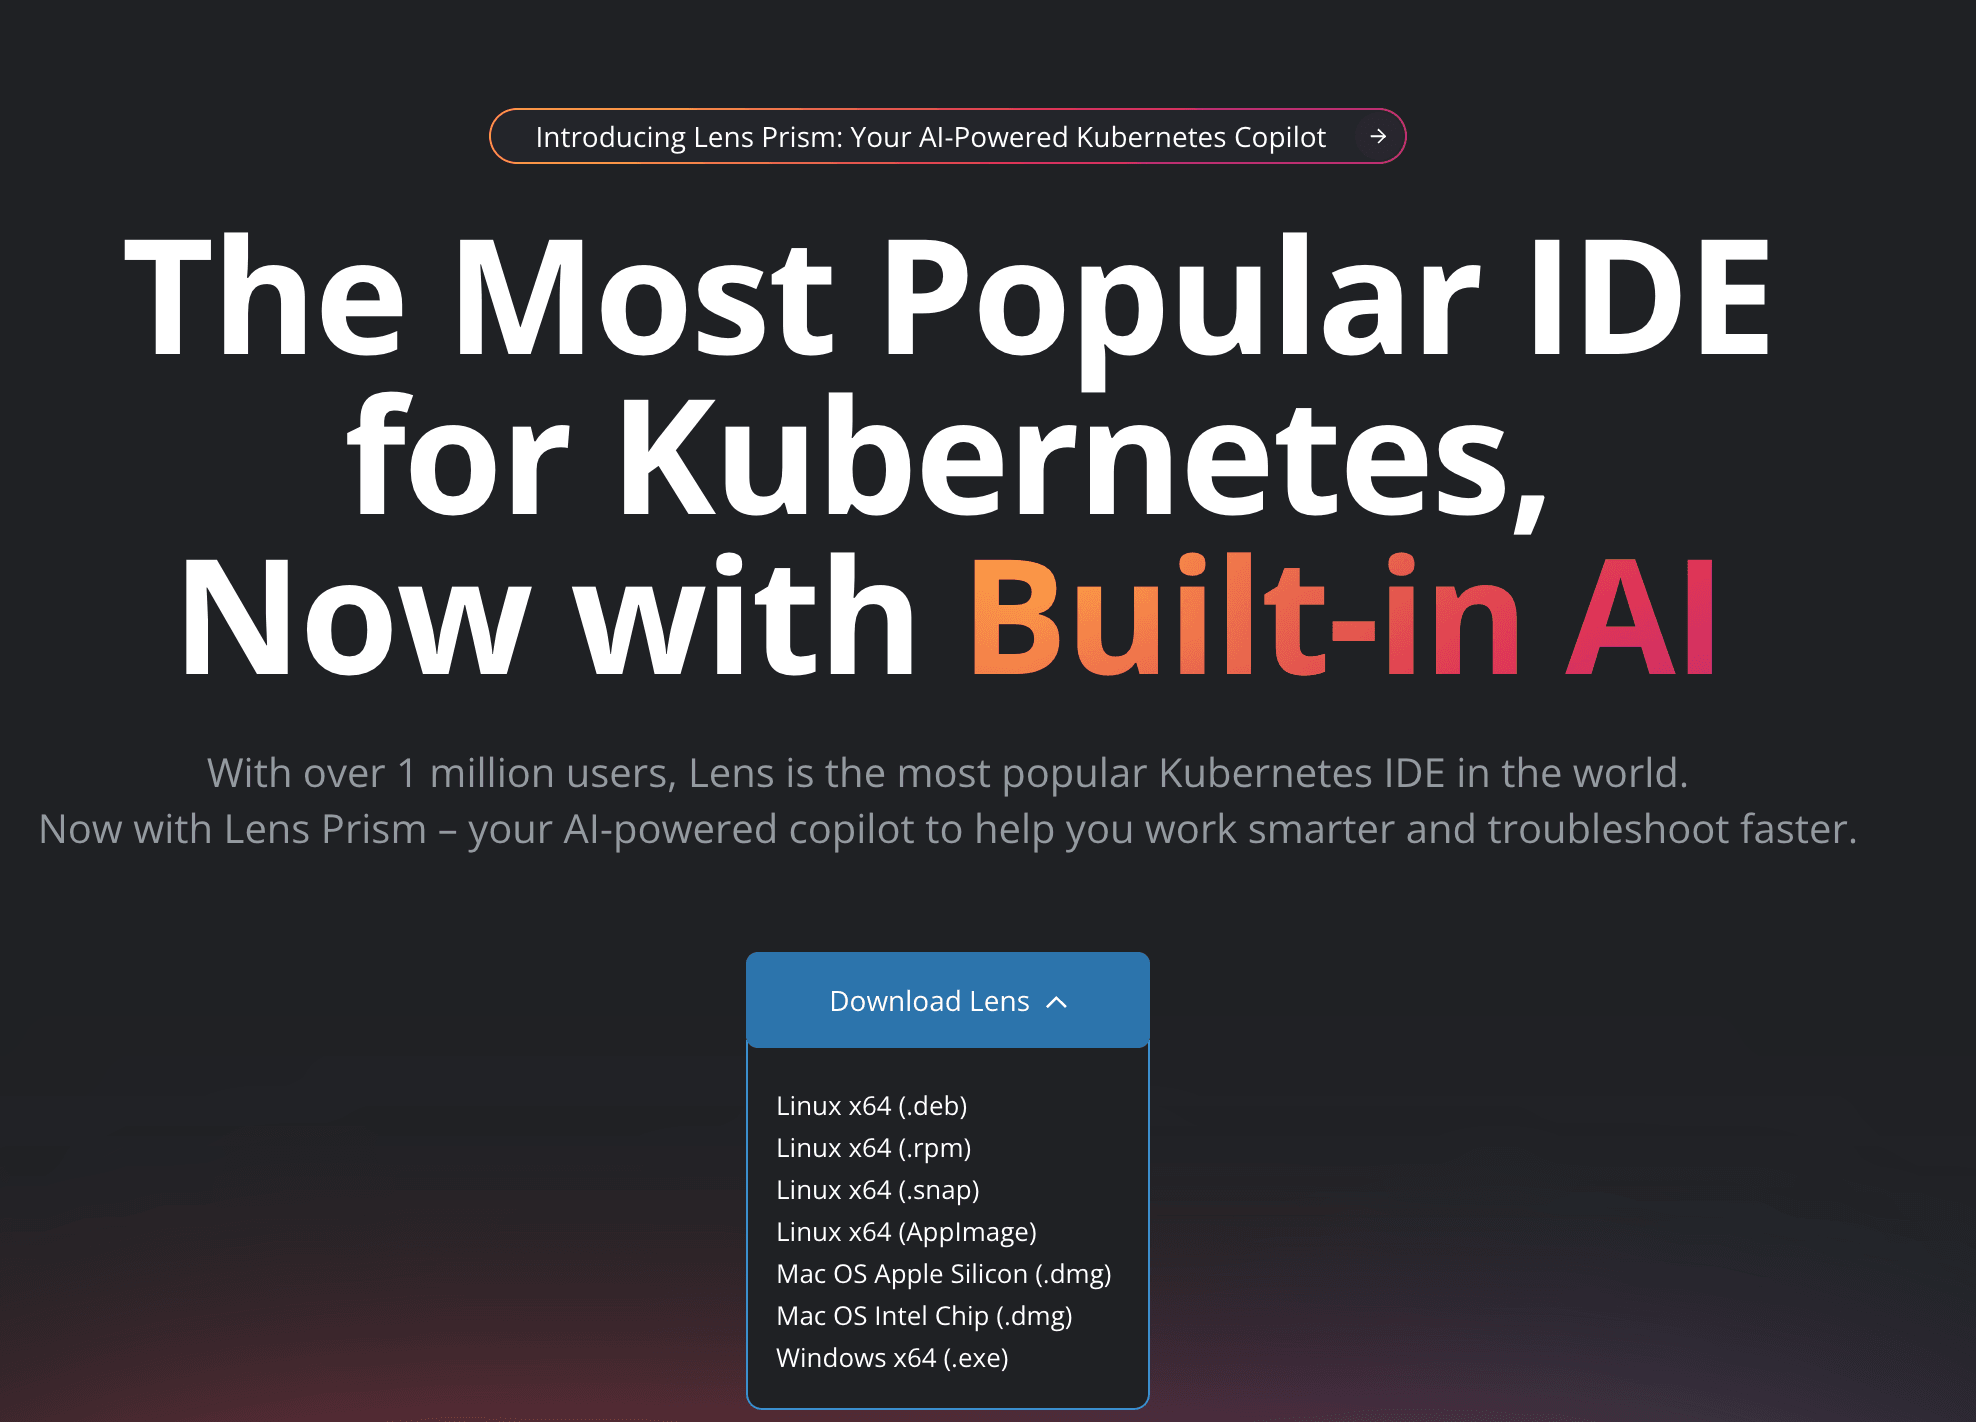
Lens K8S IDE can be installed on macOS, Windows, or Linux. The easiest way to do that, is to go to the Lens website, and click on Download Lens:
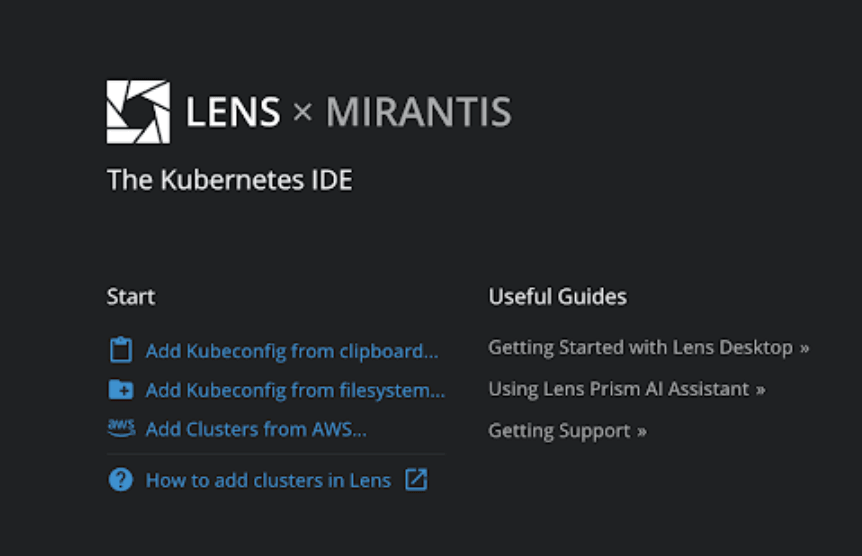
After you download it, use the installer and follow the instructions from it. As soon as you install Lens K8s IDE, you will also need to activate it, and create your own Lens ID.
As soon as you activate Lens K8S IDE, you are redirected to a Welcome screen in which you get an overview of some of the things that you can do, and some useful guides:
Lens K8S IDE automatically scans and loads any contexts found in your local ~/.kube/config, so if you have any cluster configurations saved in the default path of kubeconfigs, you don’t need to do anything.
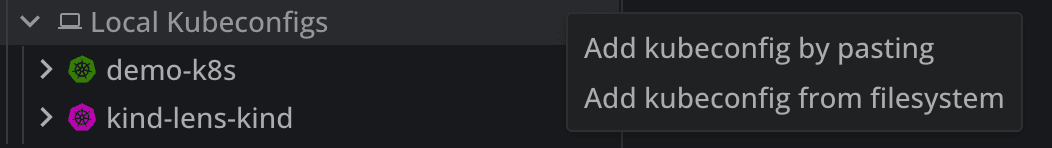
On the other hand, if you want to add other K8s cluster manually, you can easily do that by clicking on the + Add Cluster, near the the Local Kubeconfigs:
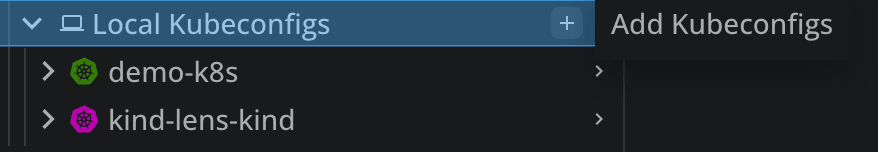
Then you will see two different options to add your clusters, either by pasting a kubeconfig, or adding it from the filesystem.
Navigating the Lens K8S IDE interface
After you connect your K8s clusters, you can explore what you can actually see and do with Lens K8S IDE:
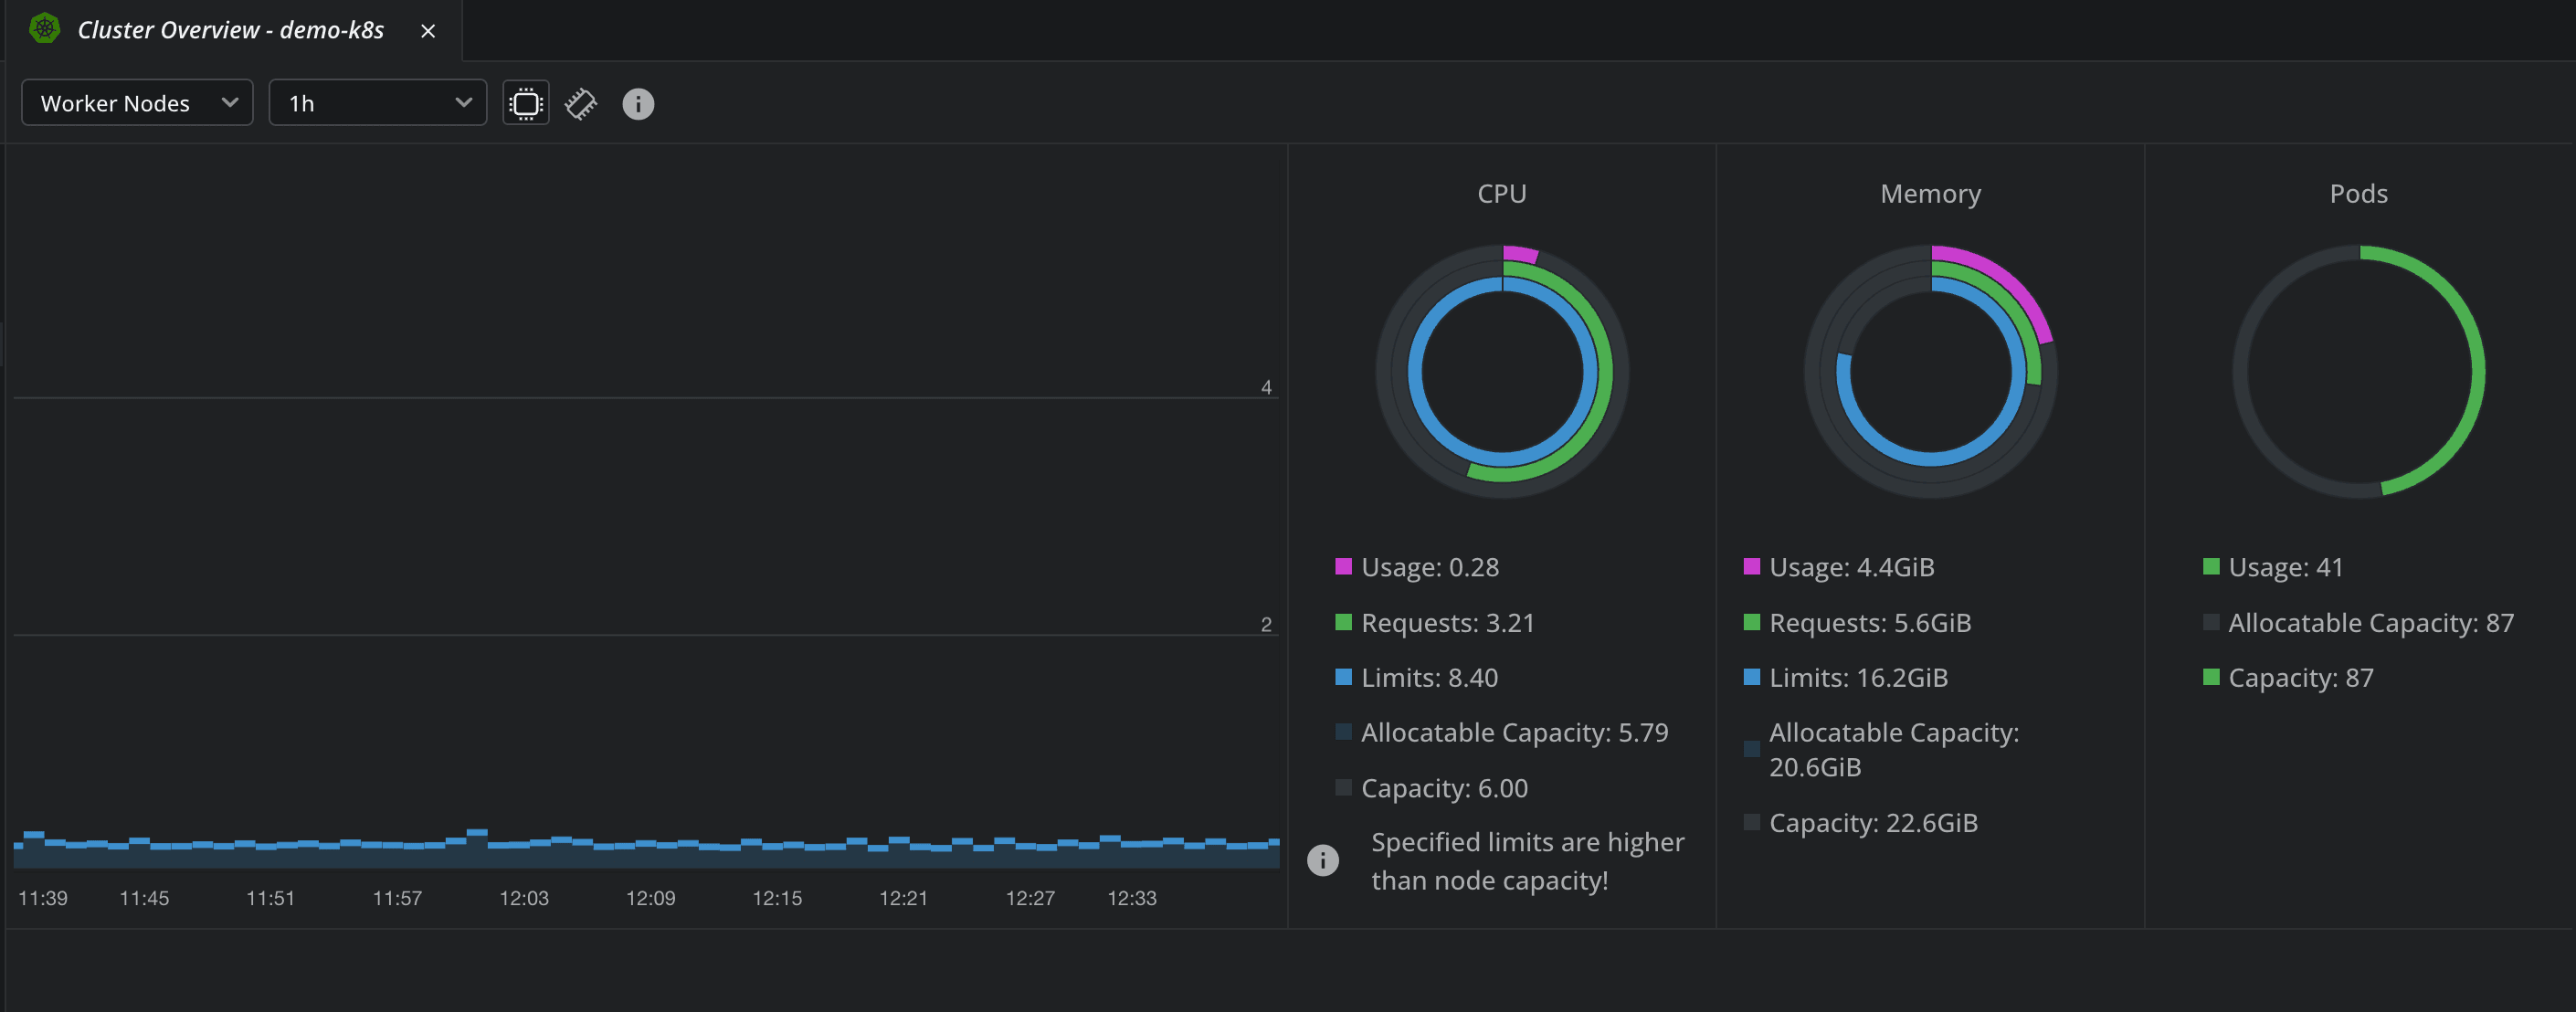
In the Overview tab, you get information about CPU, and memory usage, and also about how many pods you have and what is their capacity. In addition to this, you can also see a list of problems that you have inside of your clusters, based on the events that have happened.
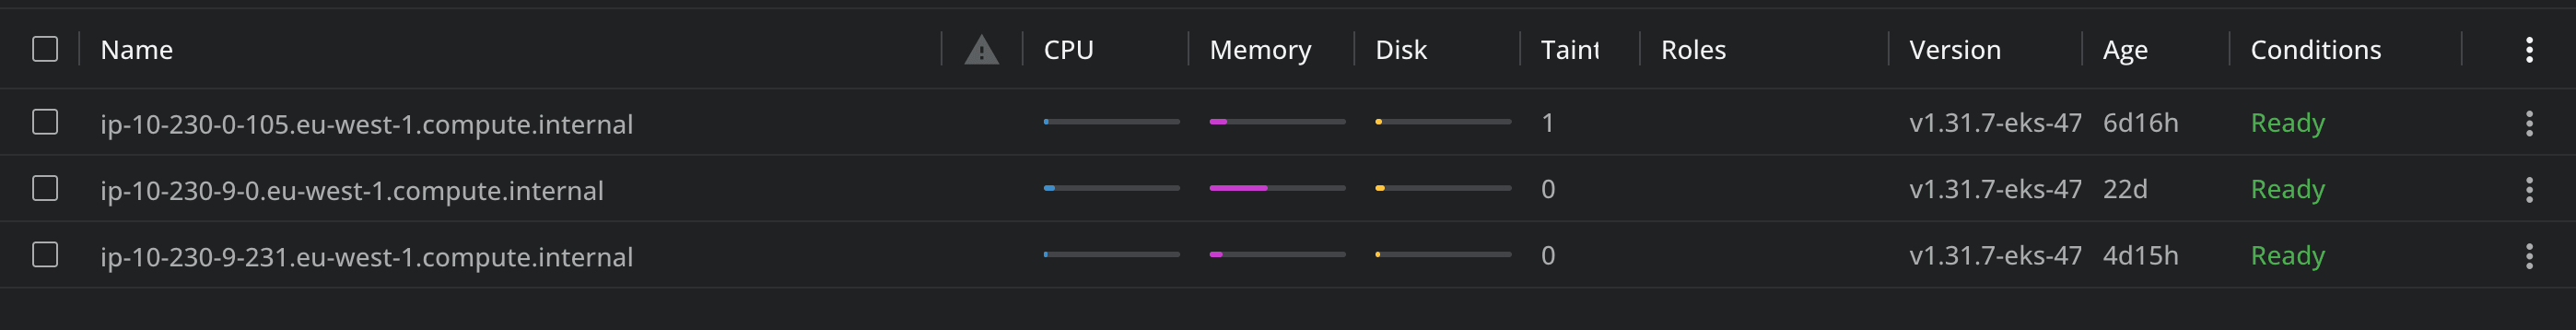
In the Nodes tab, you will see relevant information about your nodes, such as CPU, memory usage, disk usage, their versions, and also their age.
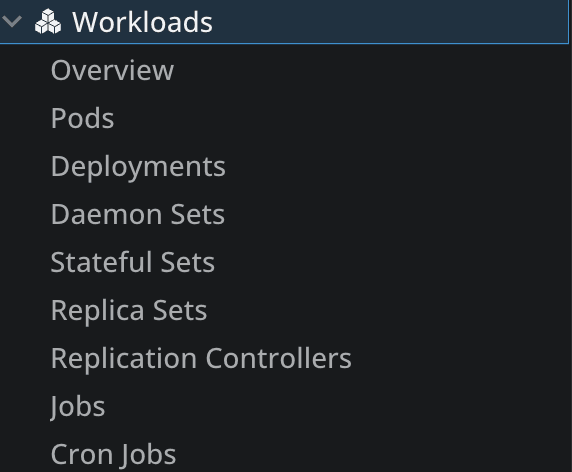
In the Workloads tab, you can see many details about your K8s resources (pods/deployments/daemon sets/etc).
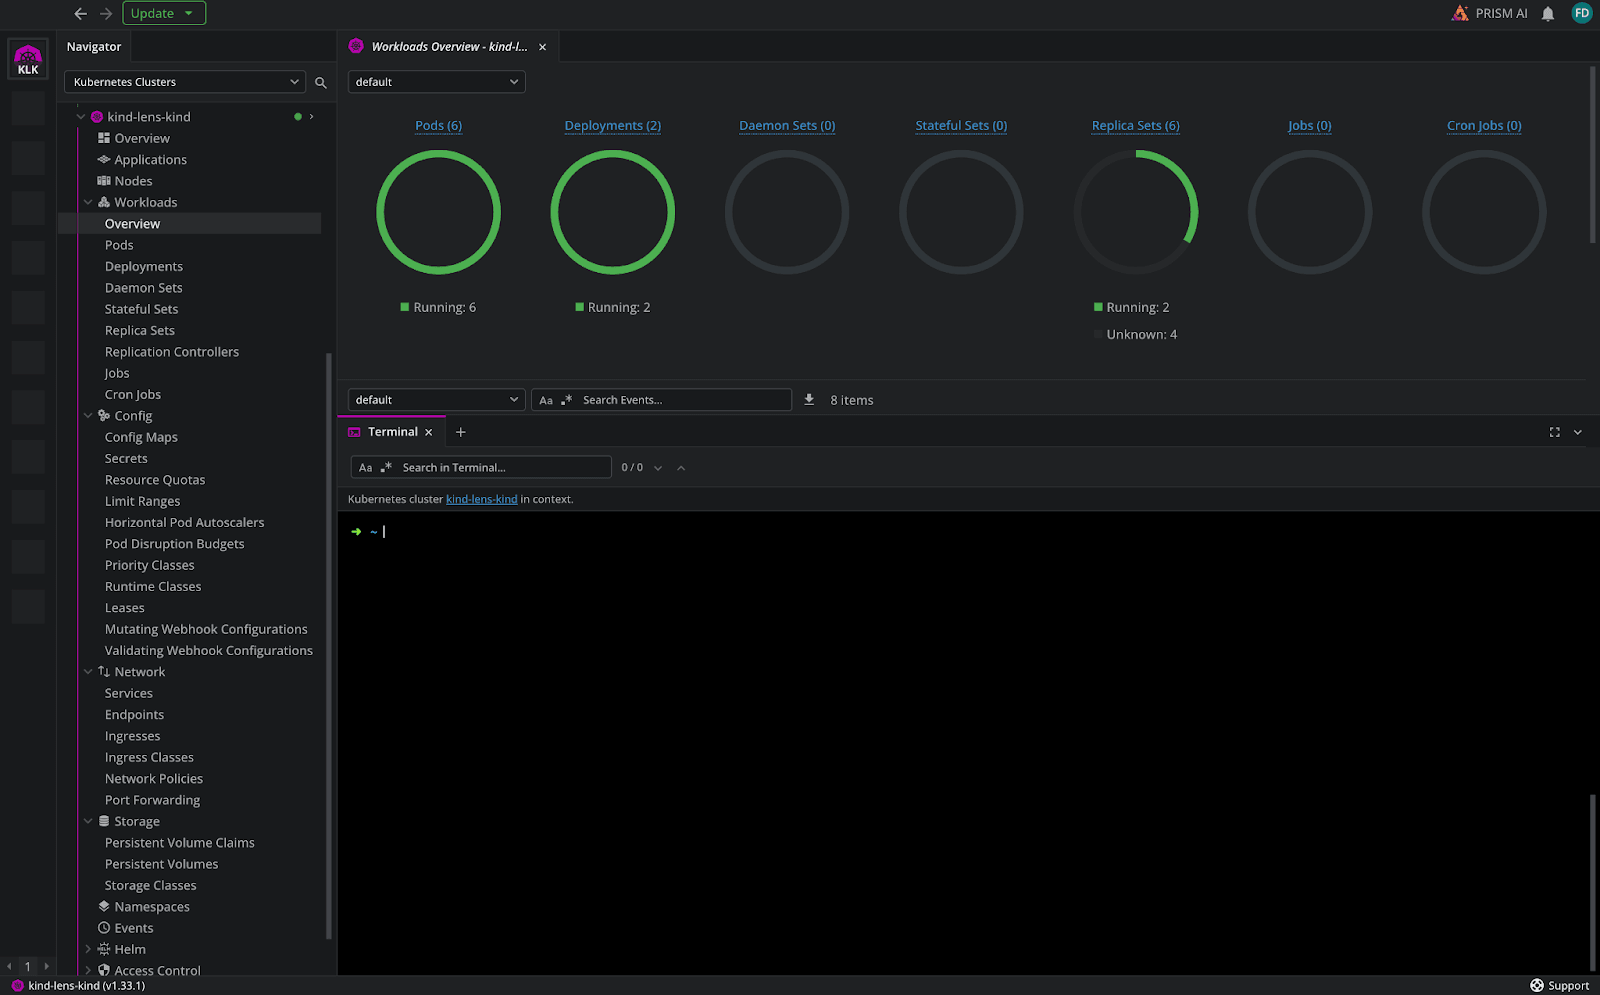
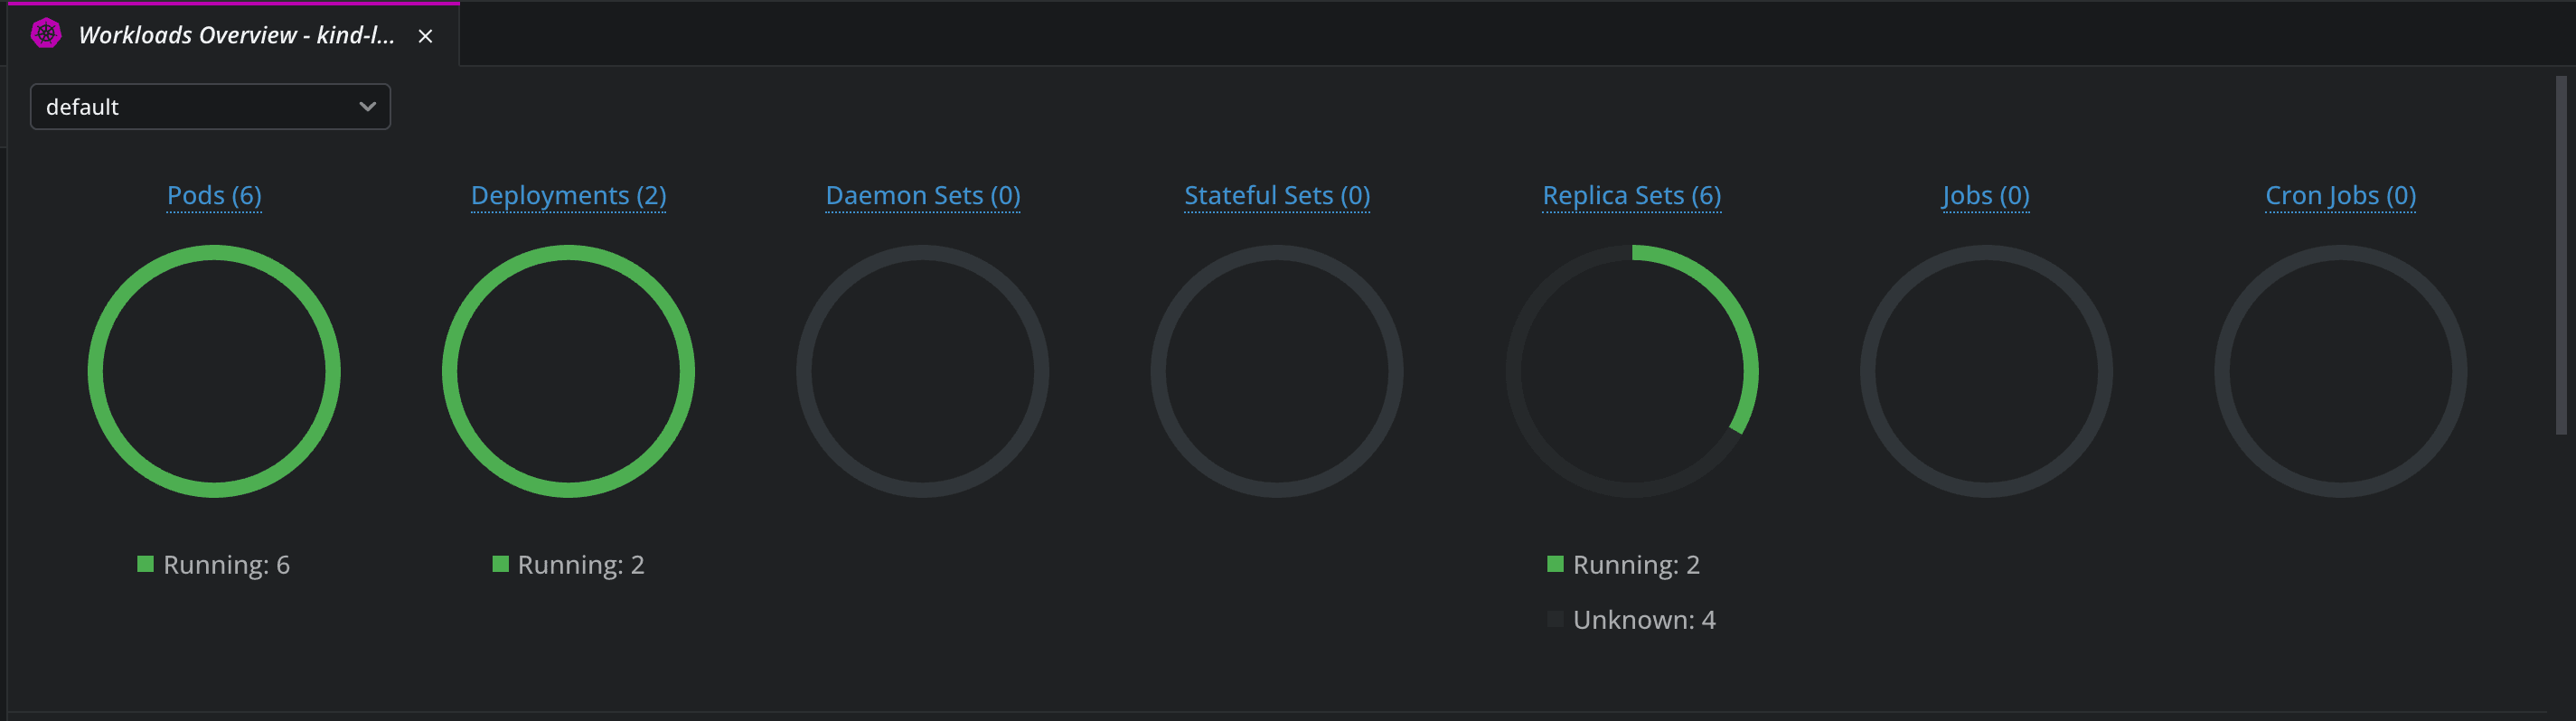
In the Workloads Overview tab, you get an overview of all the resources that are deployed in your K8s clusters, and what are the latest events that happened in your cluster.
By opening a terminal while clicking in a particular cluster, the context is automatically set for that particular cluster inside it, so you won’t need to run kubectl config get-contexts to see all your available contexts and kubectl config use-context context_name to set that particular context.
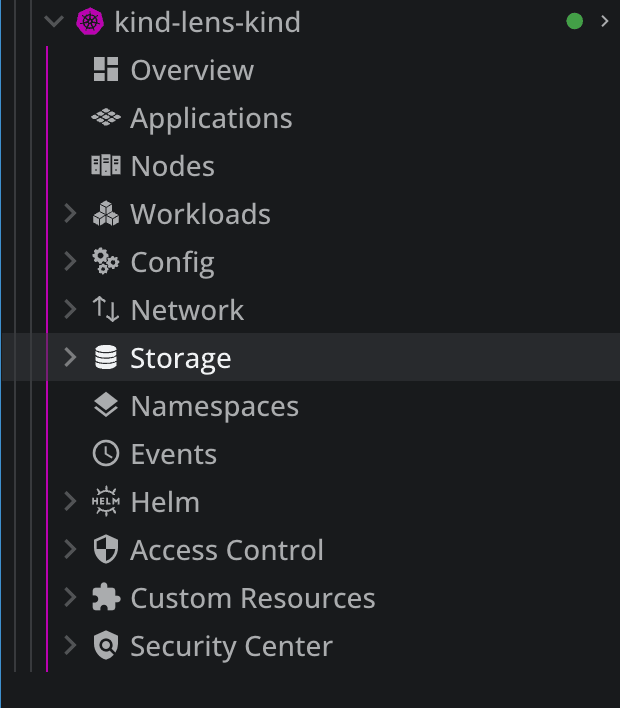
Other tabs that you should explore:
- Config – get details about Config Maps, secrets, resource quotas, limit ranges, pod disruption budgets, and more
- Network – get details about services, endpoints, ingresses, network policies, port forwarding, and more
- Storage – get details about Persistent Volume Claims, Persistent Volumes, and Storage classes
- Namespaces – view all namespaces
- Events – see what has happened inside of your clusters
- Helm – view information about helm charts and releases
- Custom Resources – see their definitions
As soon as there are any changes done to your clusters, Lens K8S IDE picks them up and shows them immediately through the interface. You don’t need to do any manual refreshes for this, and this level of live insight into your cluster operations is simply no match for the amount of kubectl commands you would need to run.
Let’s now explore what you can do in the pod tab, as this will be one of the places you will spend the most time:
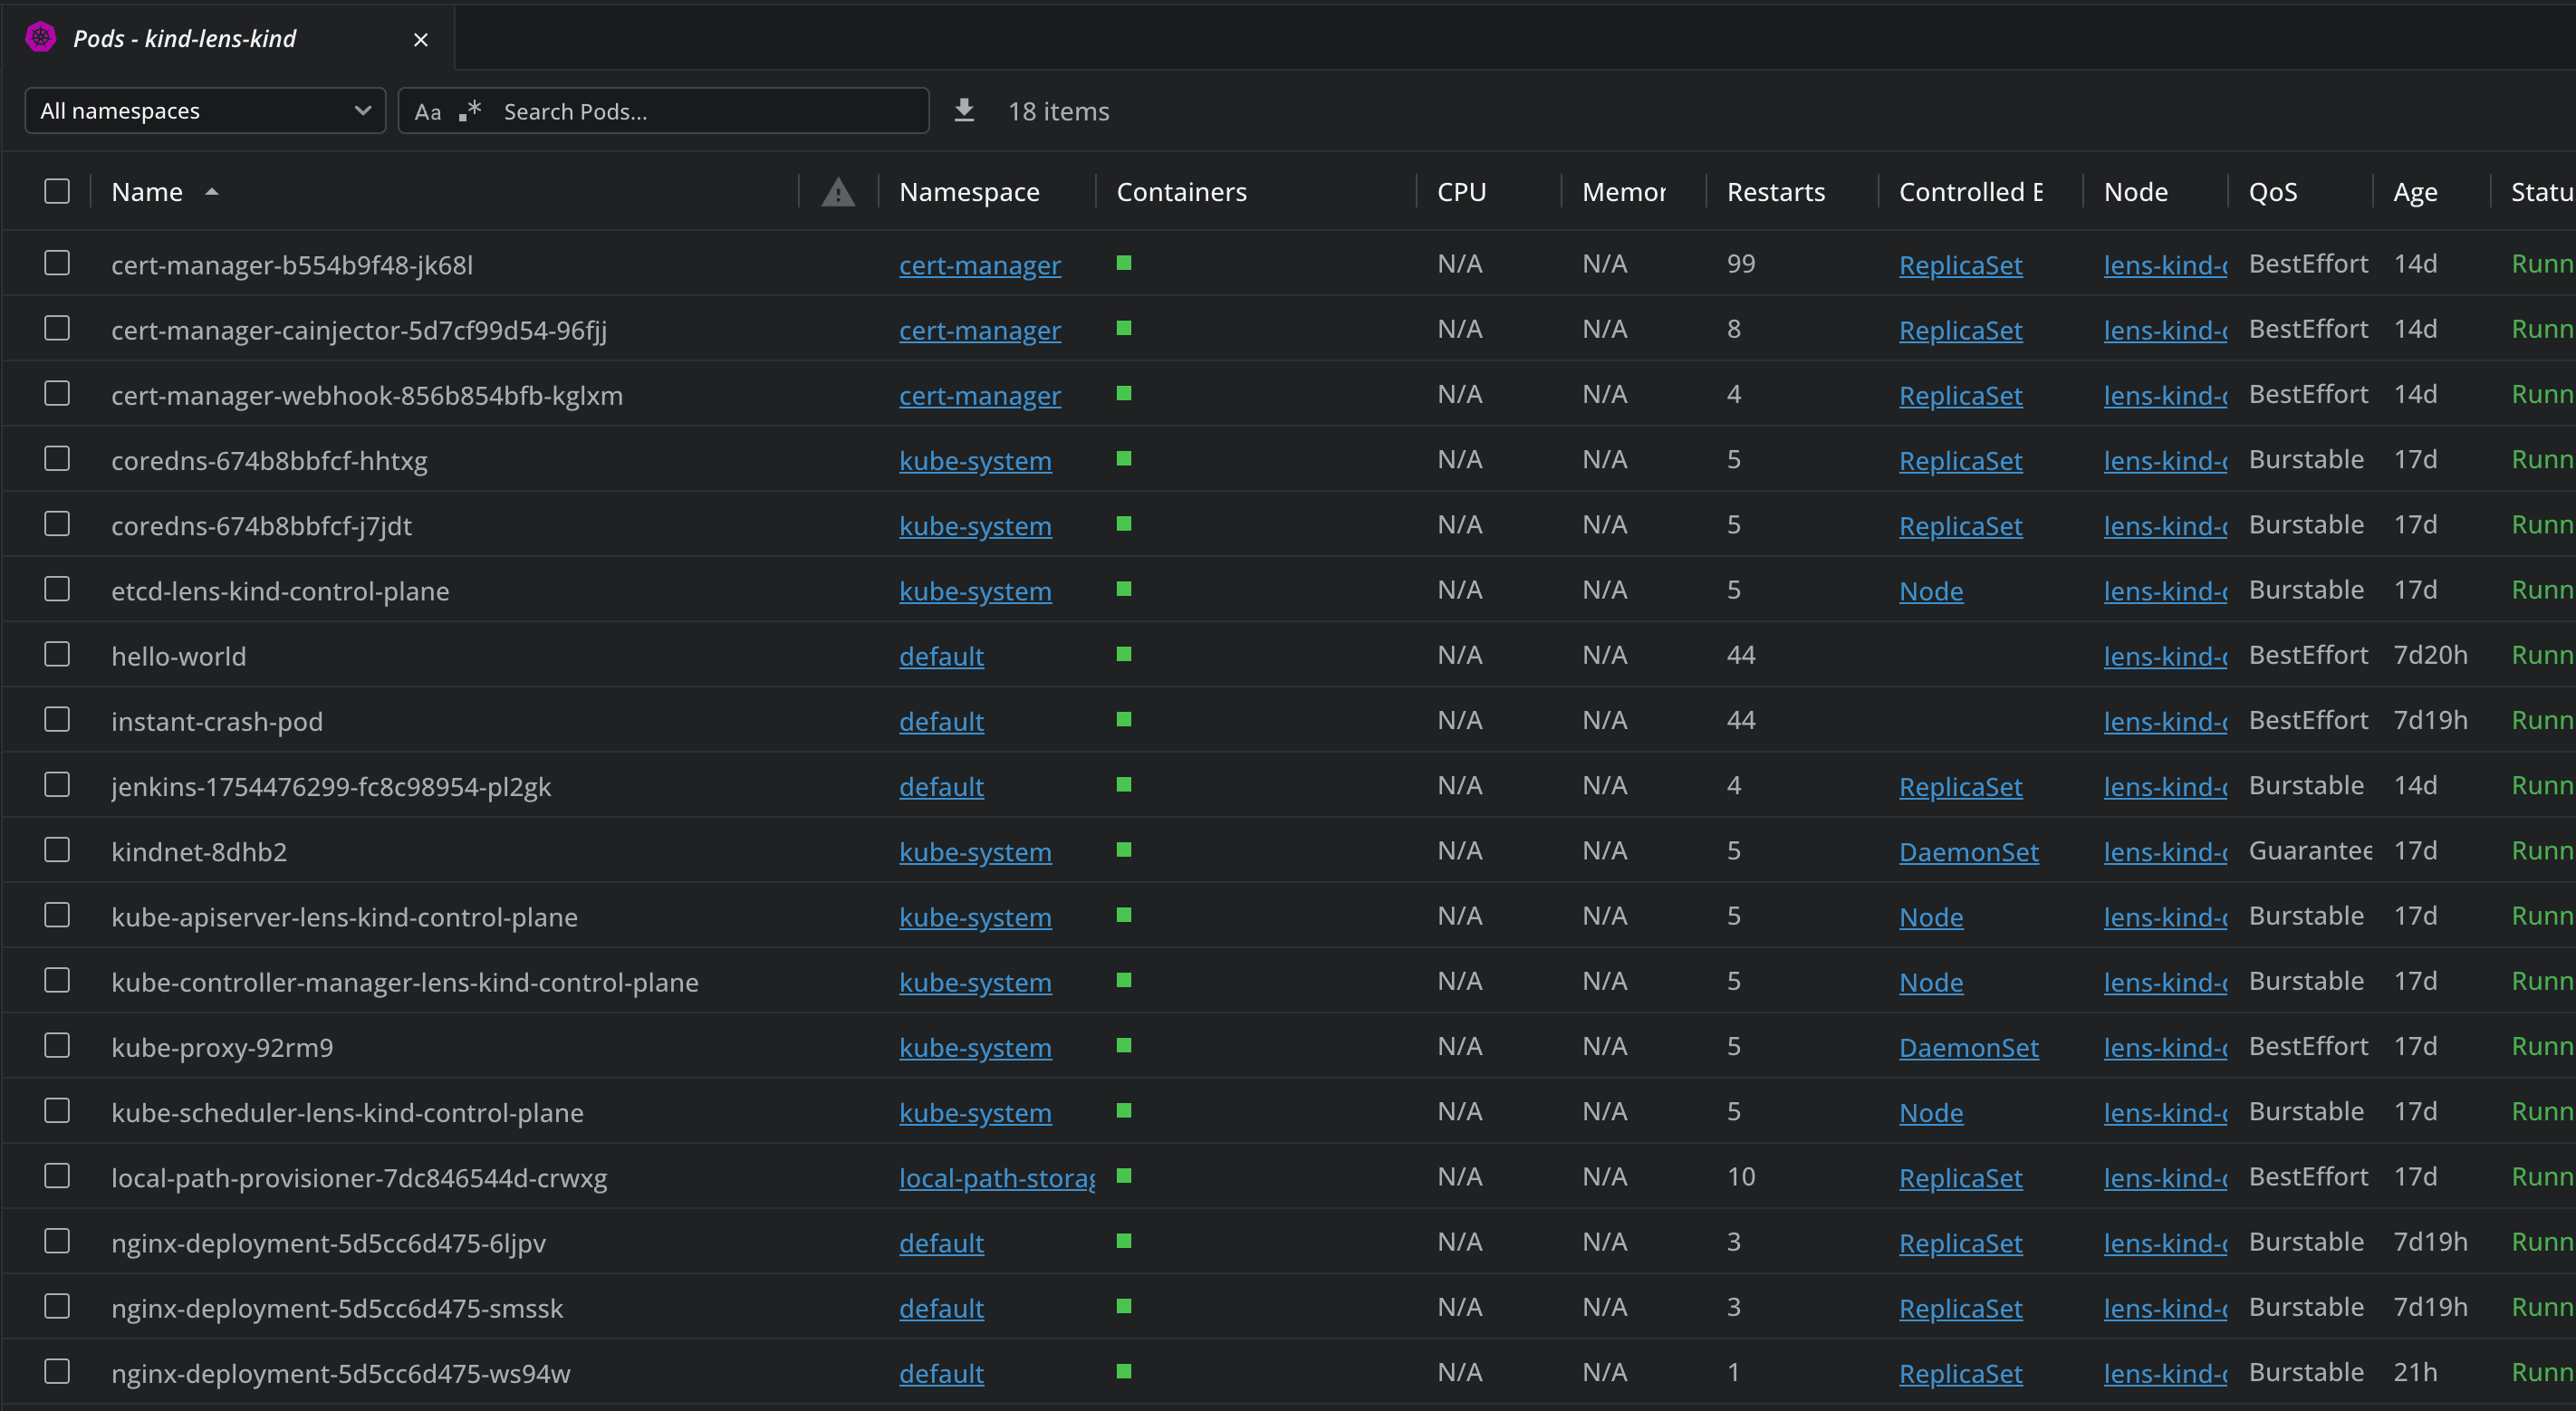
You can filter your pods by namespaces, search for particular pods, and by clicking on the 3 dots on the right side you get a couple of options such as:
- Showing details about the pod
- Attach to pod
- Use the pod shell
- Evict
- Share
- Get logs
- Edit the pod
- Delete the pod
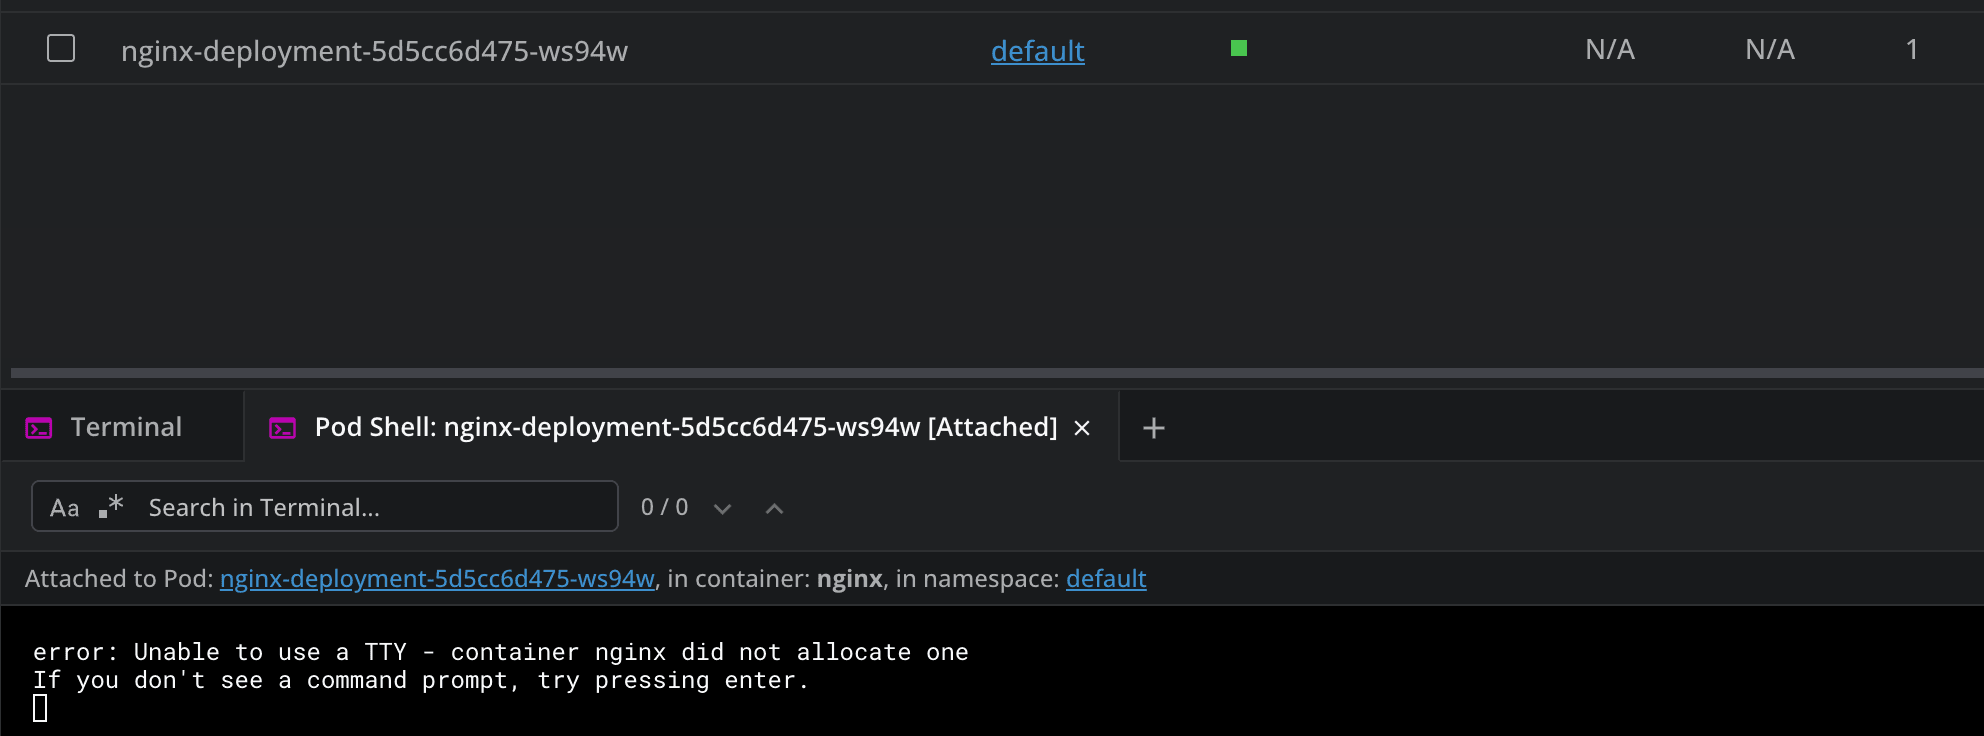
Attaching to the pod, will connect directly to the running container’s standard I/O streams, so you can interact with it in real time:
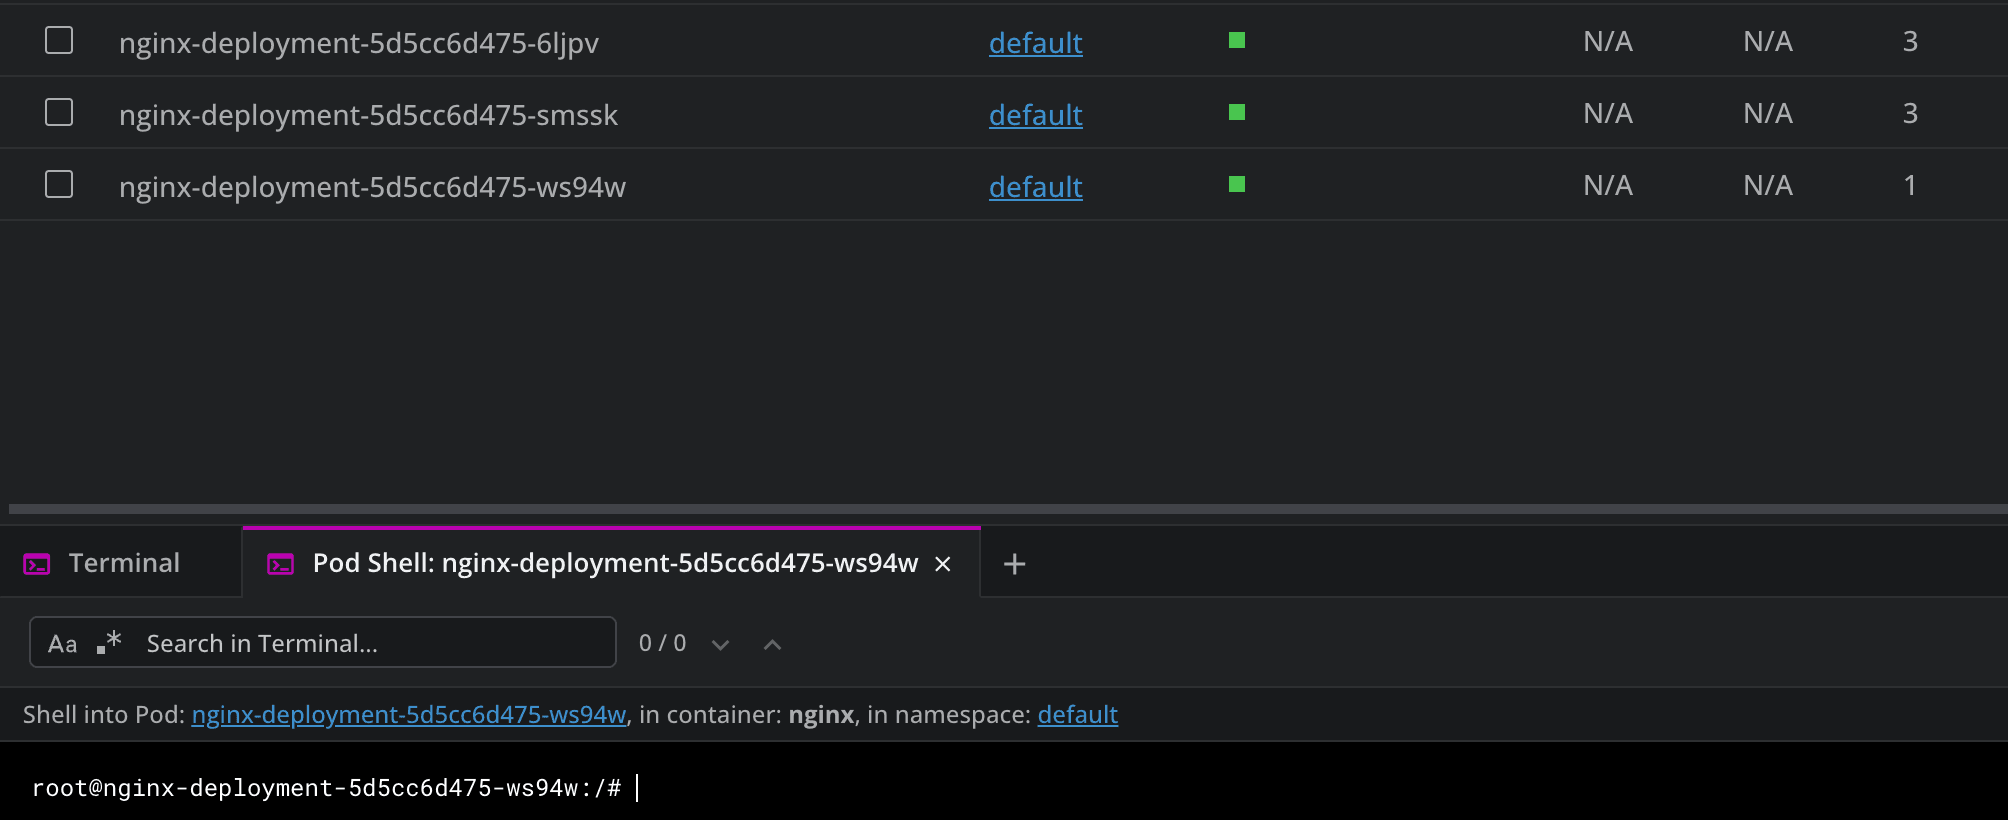
Connecting to the pod shell will give you the ability to open an interactive terminal session inside your container:
By using the logs option, you will be able to view all the logs from your pod, making the debugging process easier:
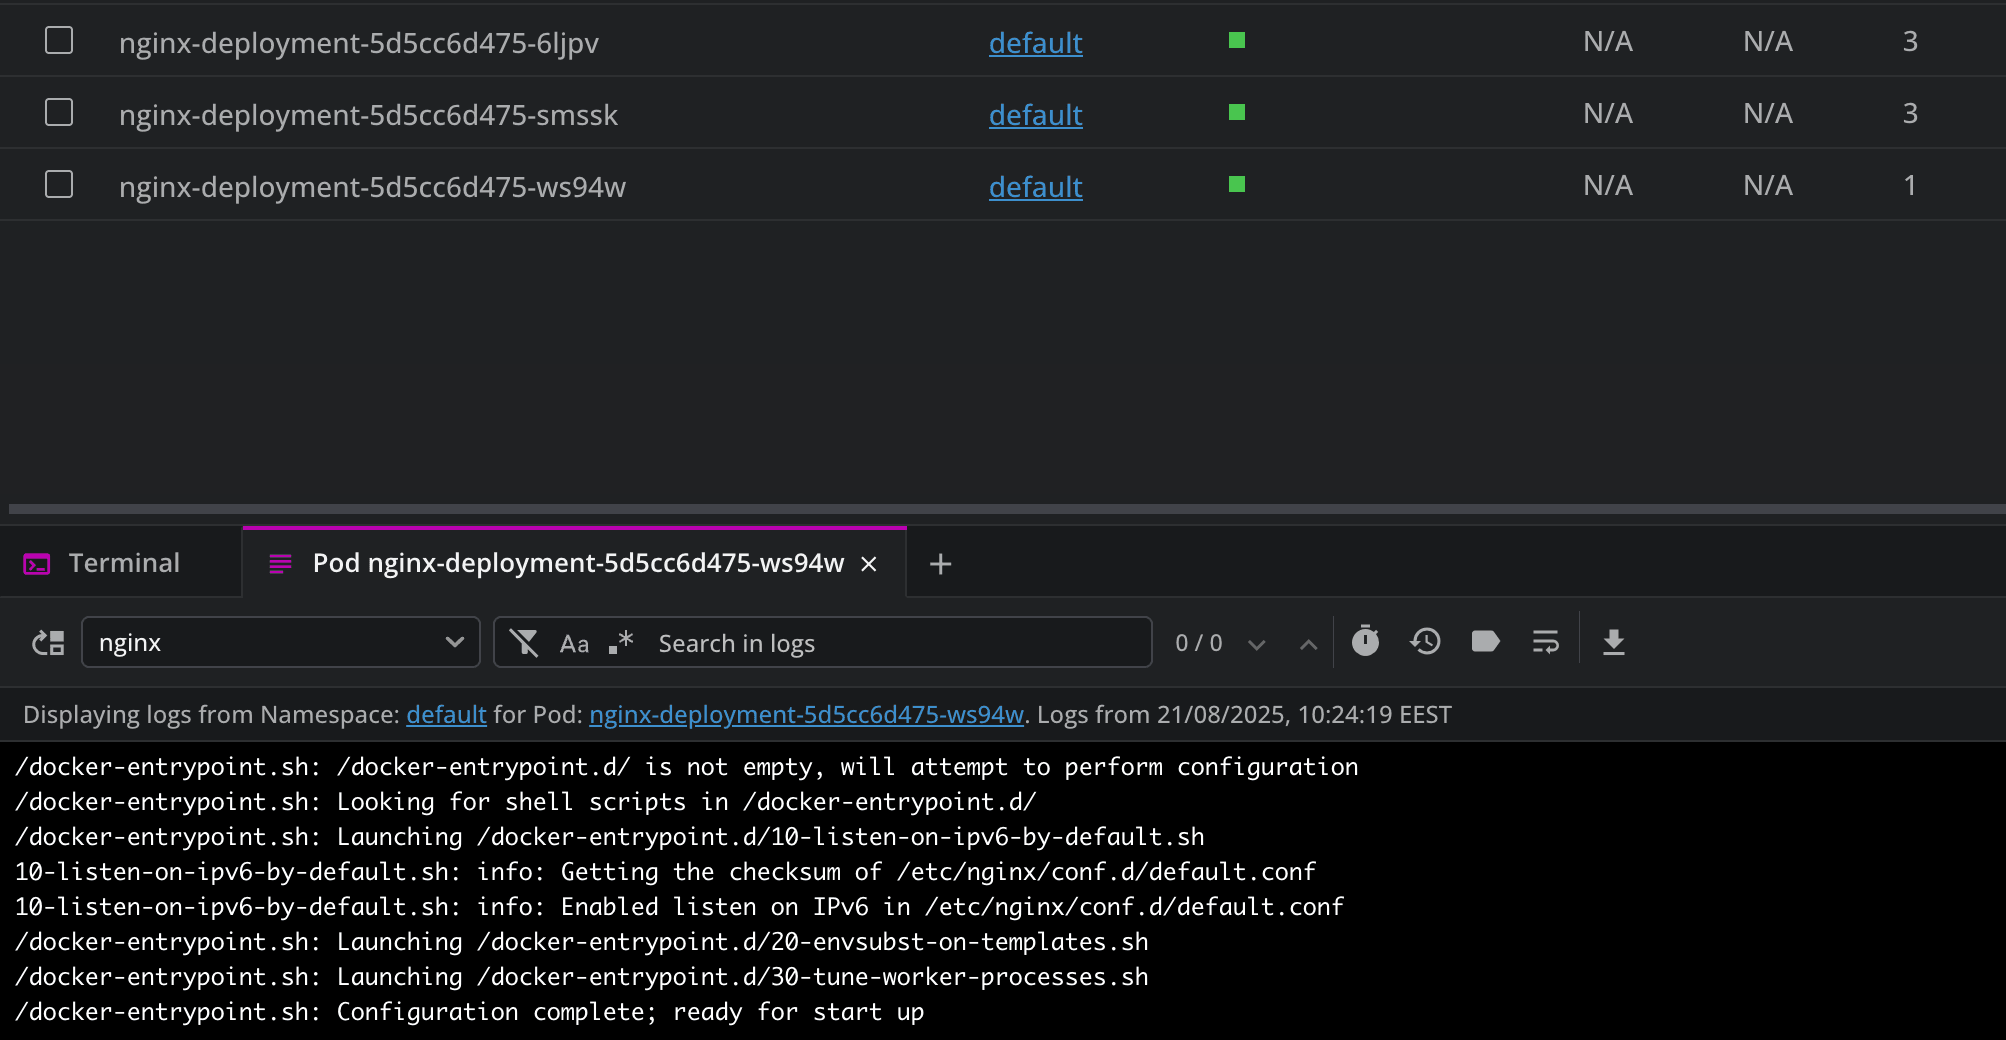
You can also search the logs to filter them for specific keywords, HTTP status codes, and others. Lens K8s IDE will then highlight the matching terms, and show the surrounding context for each one, helping you easily understand the sequence of events that led to an issue. In addition to this, you get the ability to export logs.
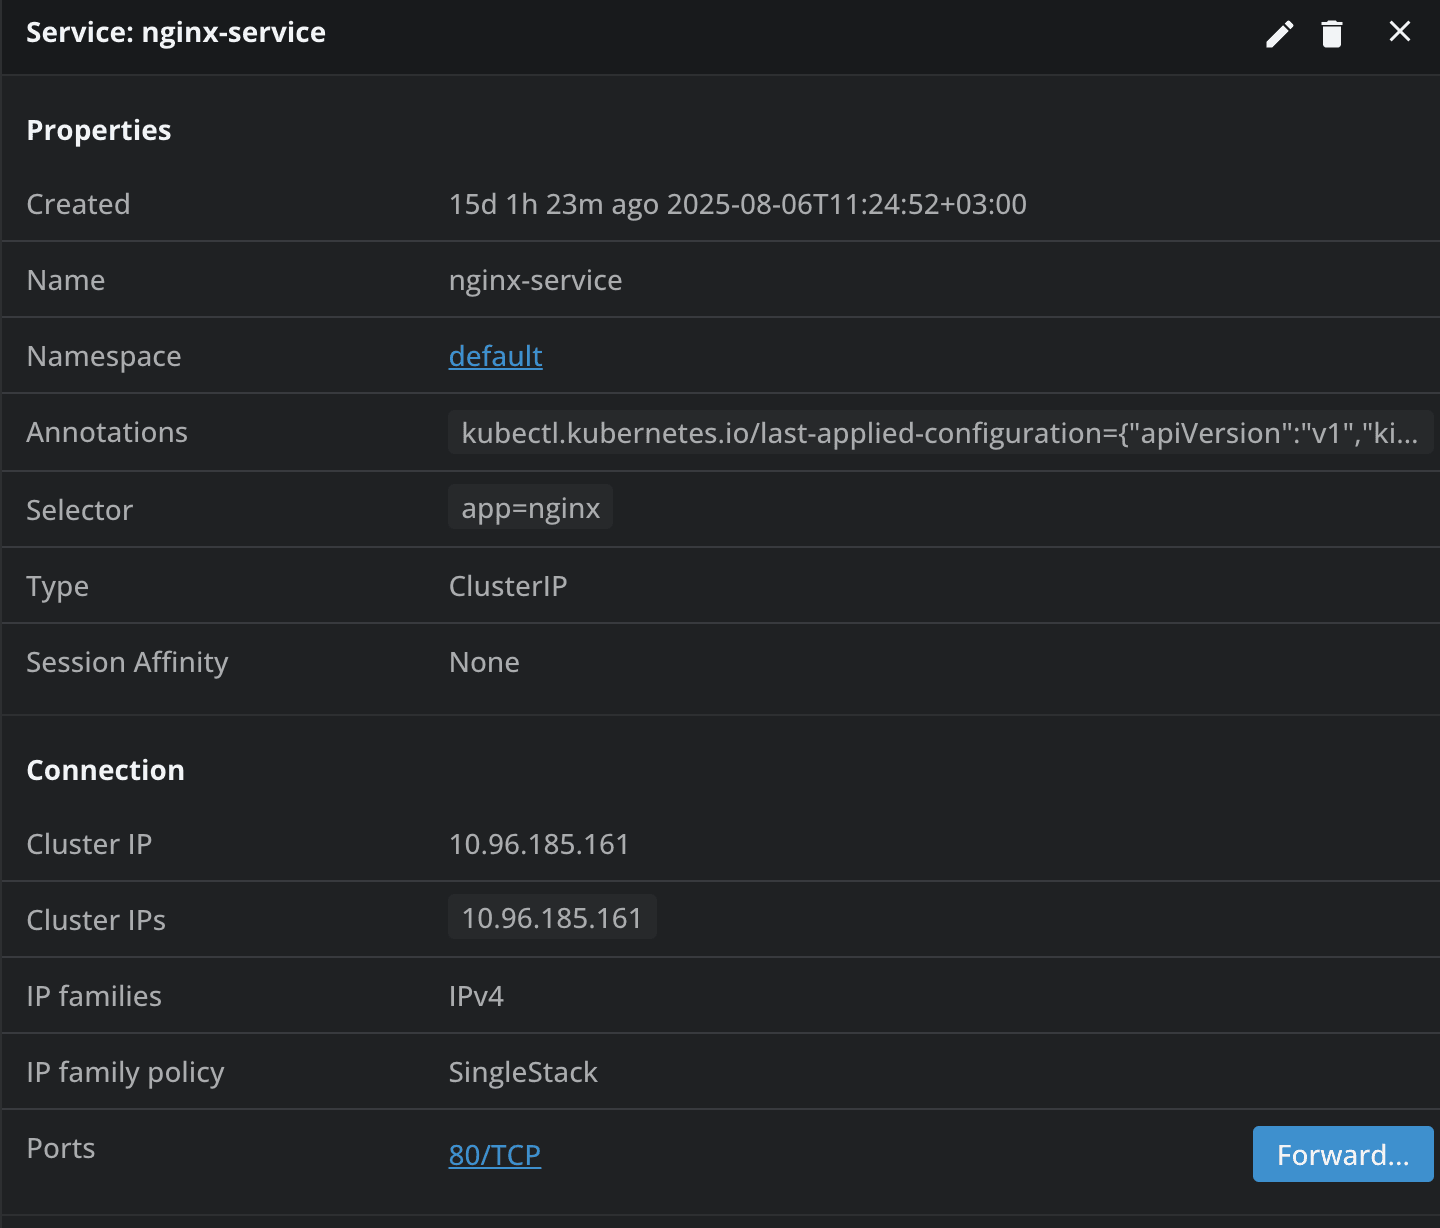
In the network tab, by clicking on a service, apart from getting details about it, you can also enable port-forwarding, which allows you to easily access your applications in your browser, and debug them as if they were running locally.
Using Helm Charts from Lens K8S IDE
Let’s now take a look at deploying a helm chart. For this example, I will deploy Jenkins inside of Kubernetes using Helm, and I will use the built-in terminal from Lens K8S IDE.
The first thing we have to do is add the Bitnami charts because they contain the Jenkins chart we are interested in. To do that we will run:
helm repo add bitnami https://charts.bitnami.com/bitnami
helm repo update
After running these commands, if we go to our K8s cluster, under Helm and select Charts, we will see all the available Helm charts.
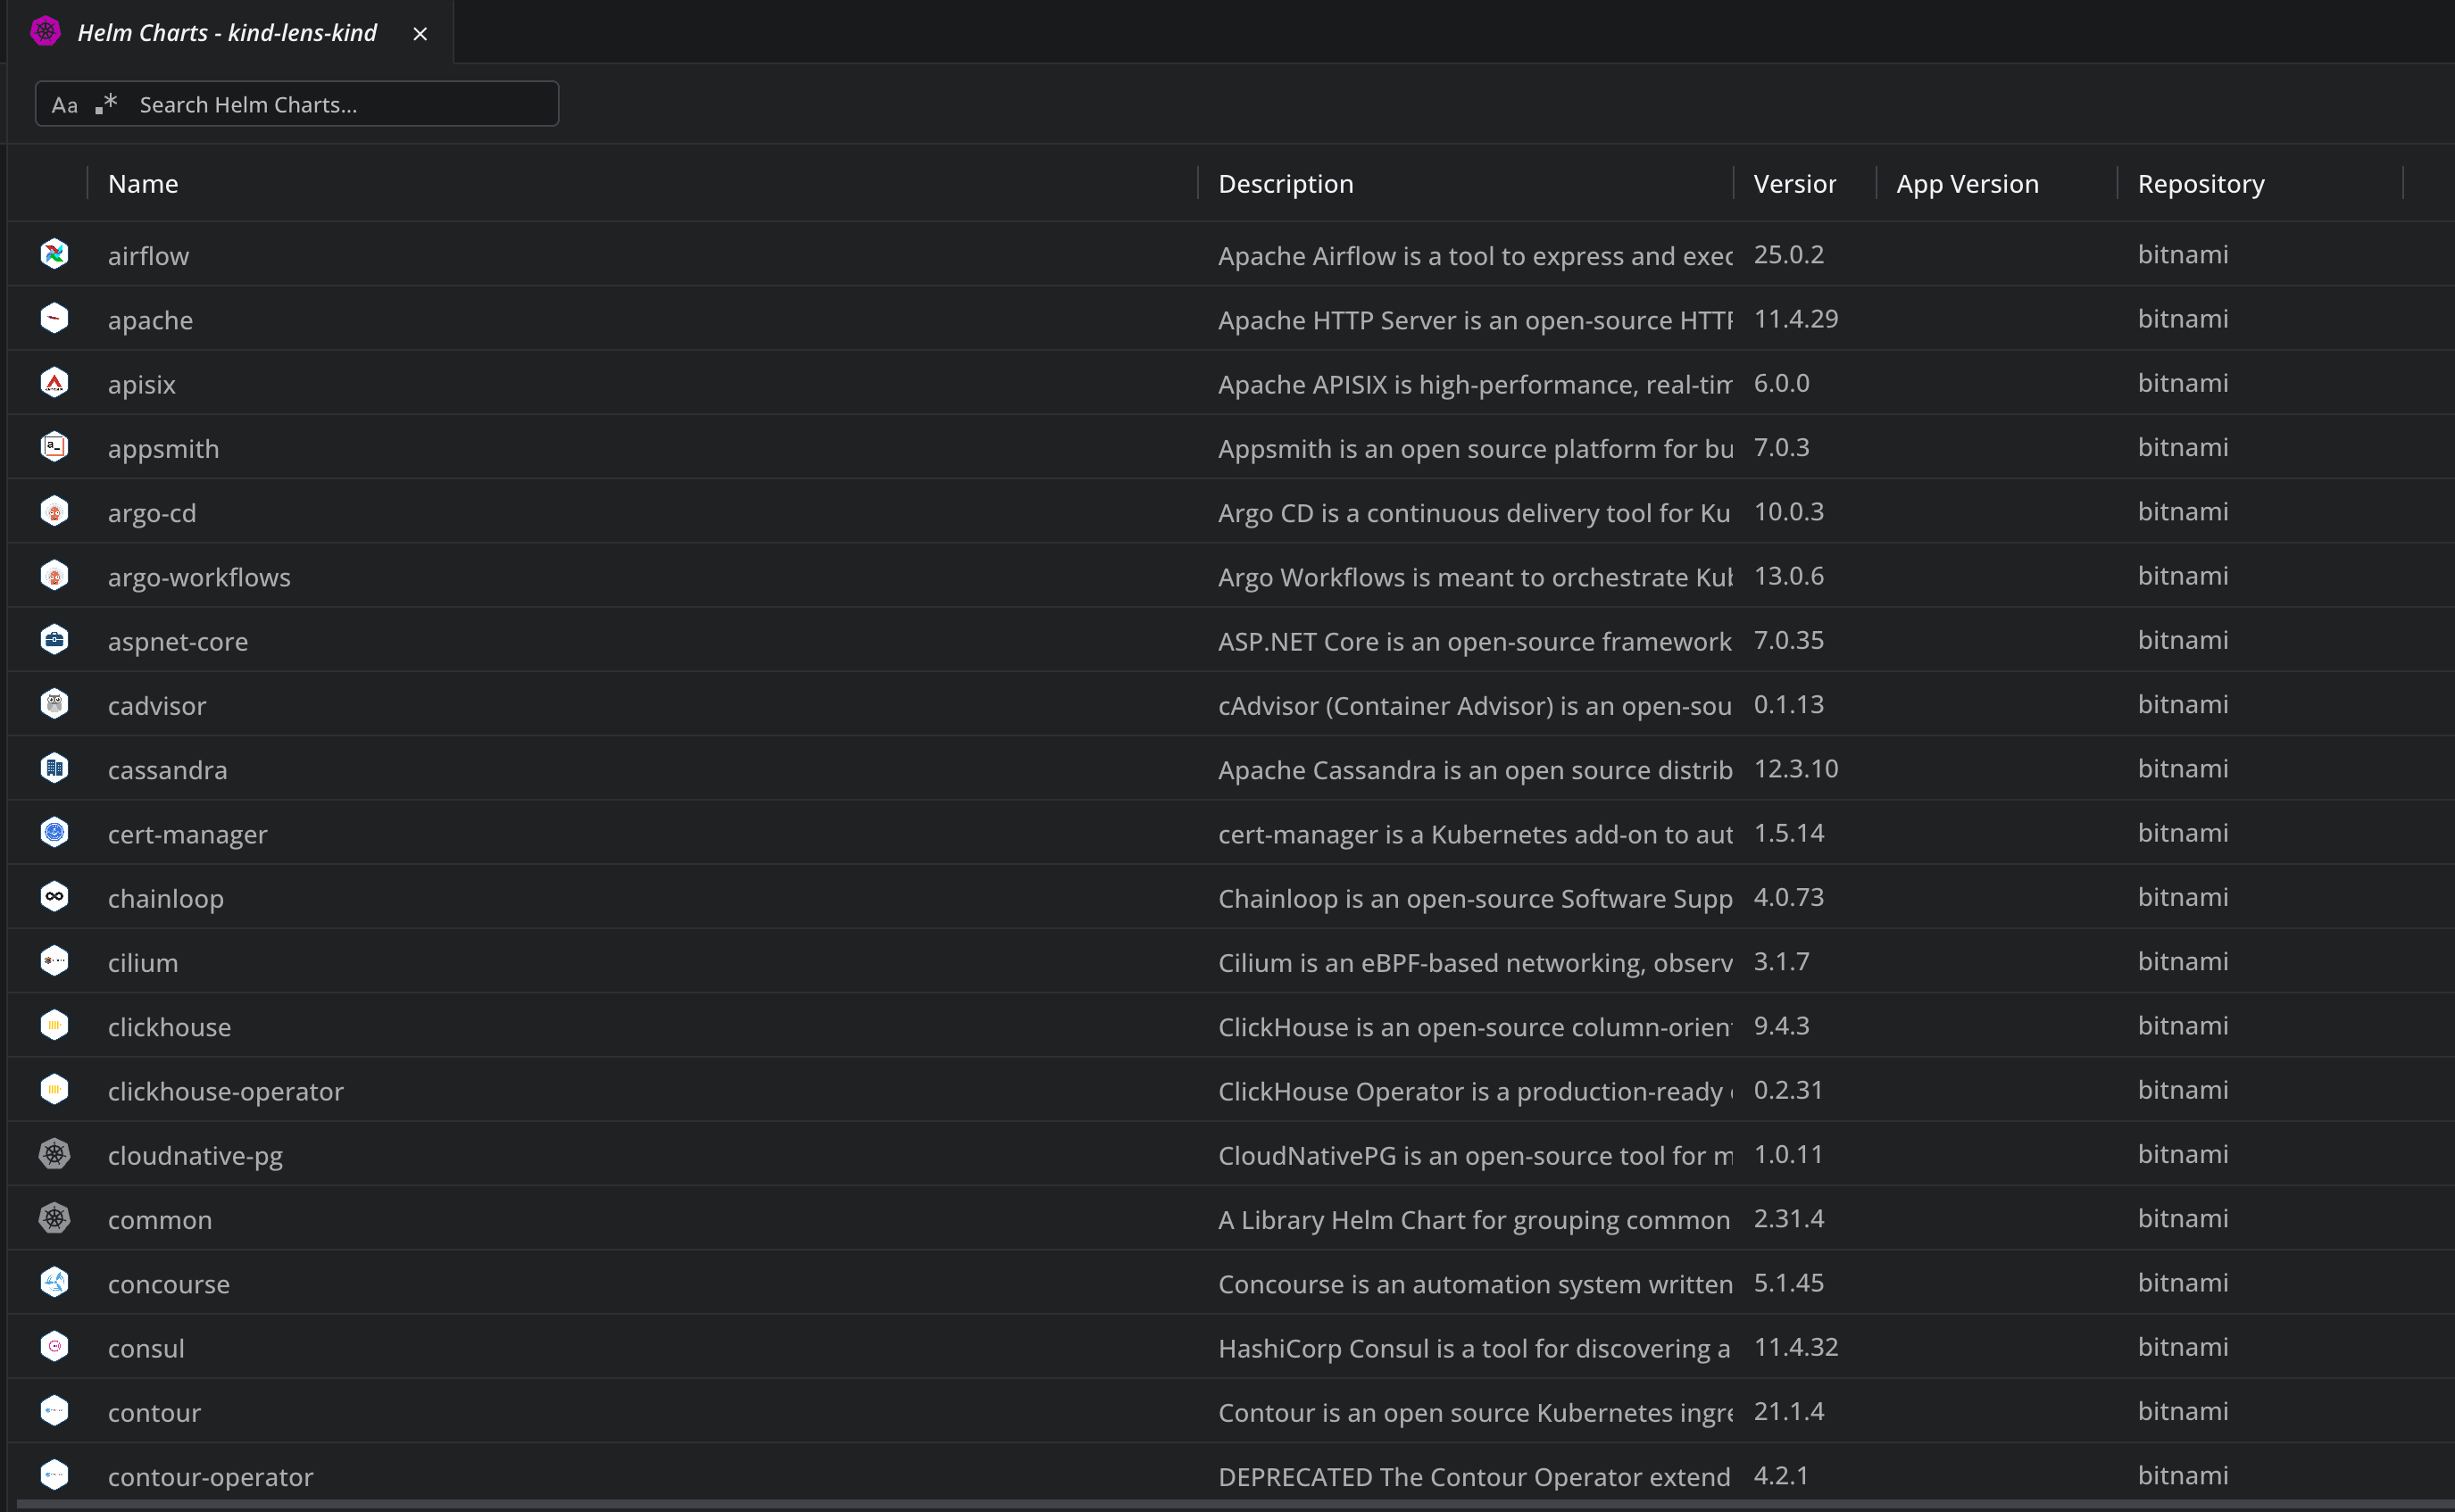
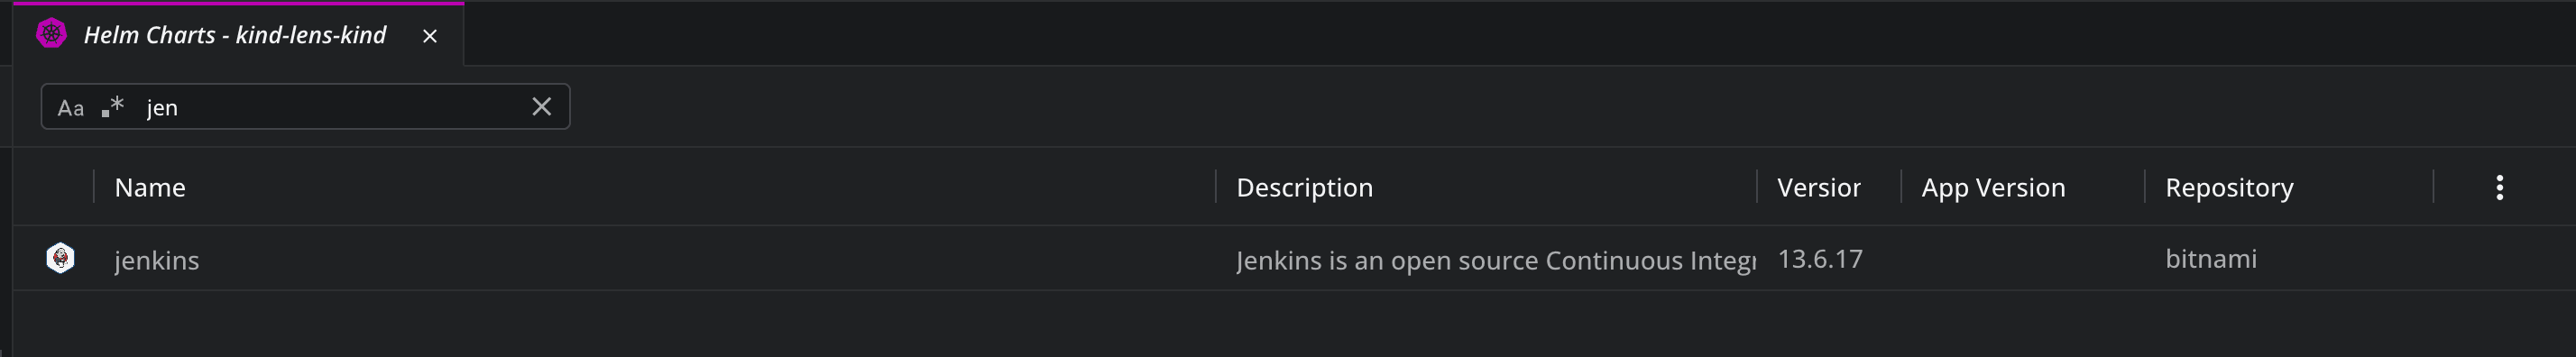
You can easily search for Helm charts as well:
Now, let’s click on the chart, and see what kind of information we get about it:
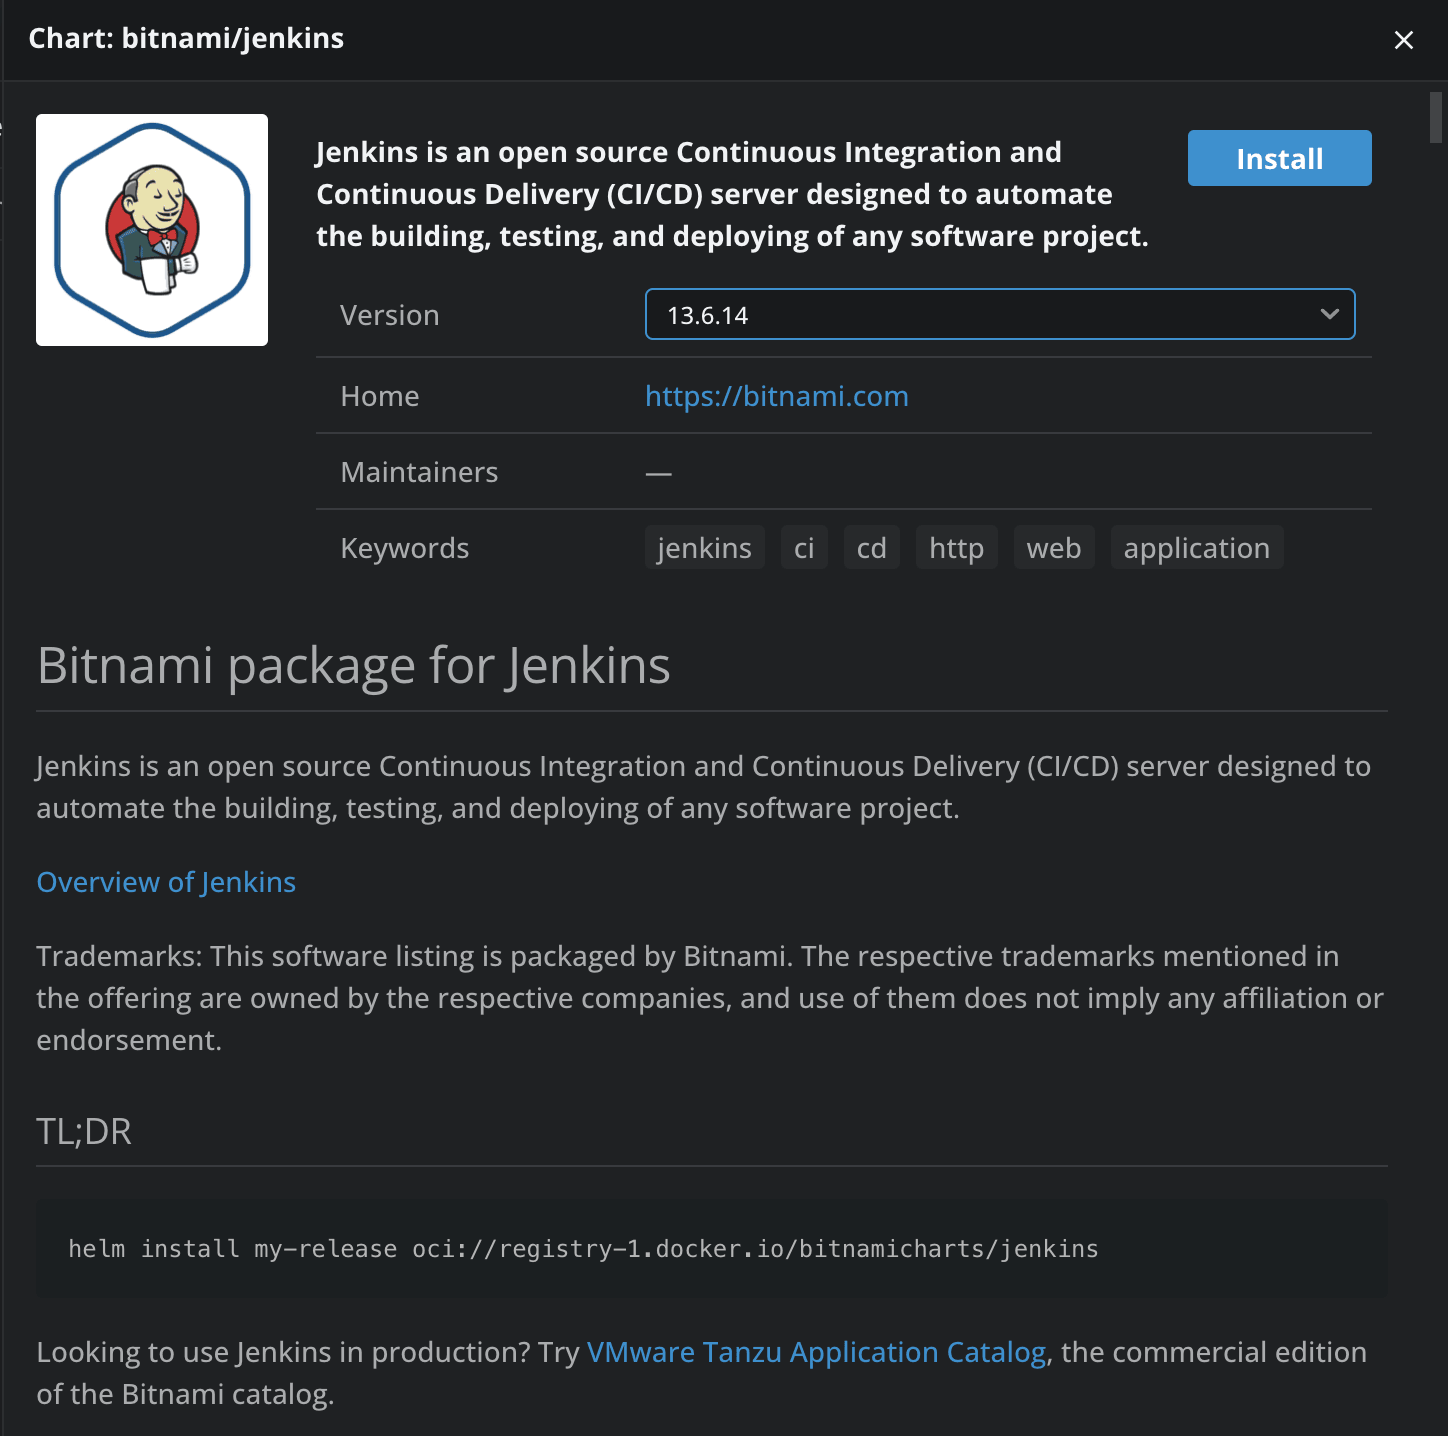
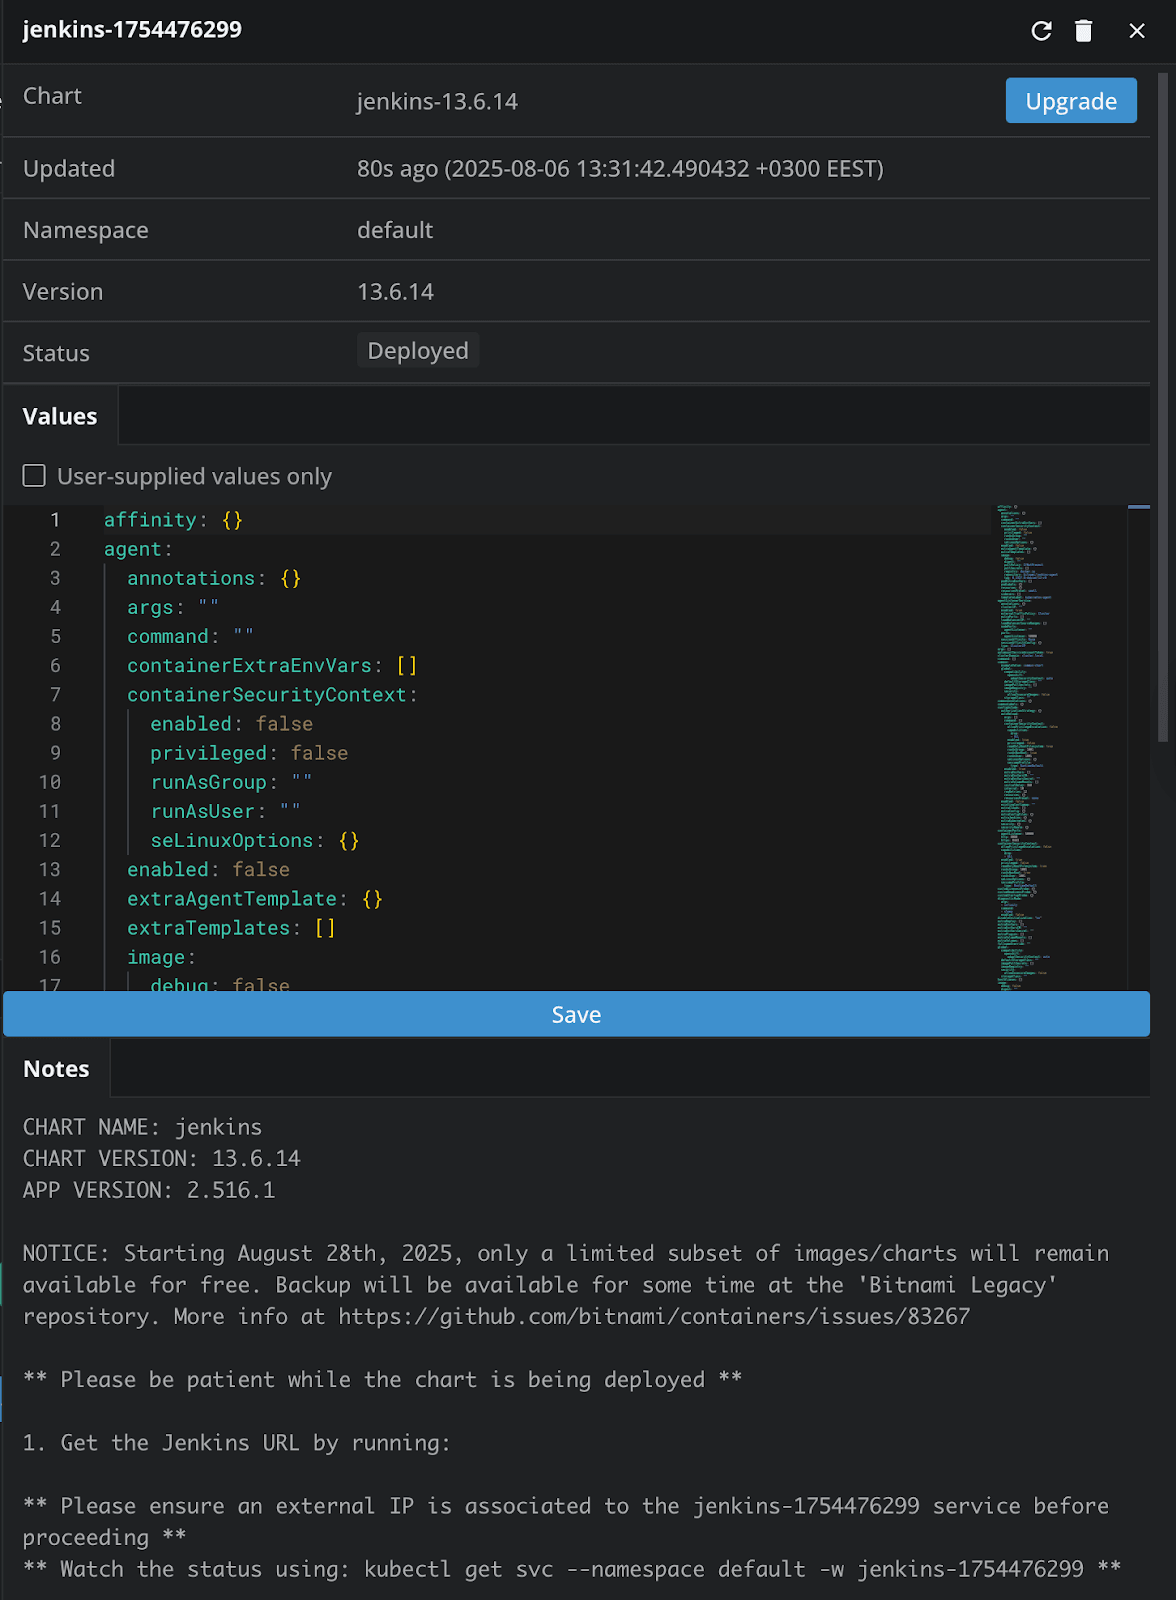
We can see what the chart is all about, and we even have an option to install it, so let’s click on Install. In the terminal, an editor will open to edit the values of the chart. After you are ok with the edits, you can click on the Save icon in the left corner, and then you will see that the chart was installed successfully:
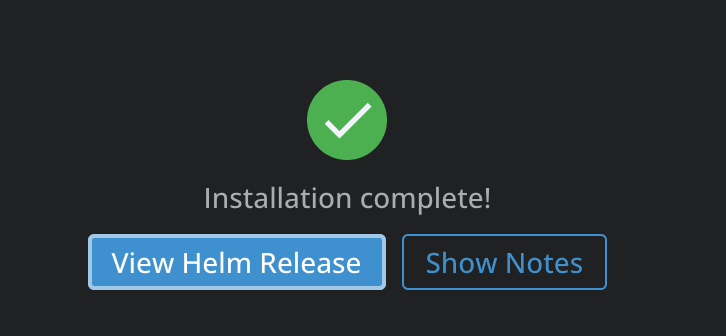
Now we can click on View Helm Release to see details about the release:
To login to Jenkins, we can go to the Services, and enable port-forwarding, as we’ve done before, if you are using a Cluster IP service. This will open our browser automatically and send us to our Jenkins instance:
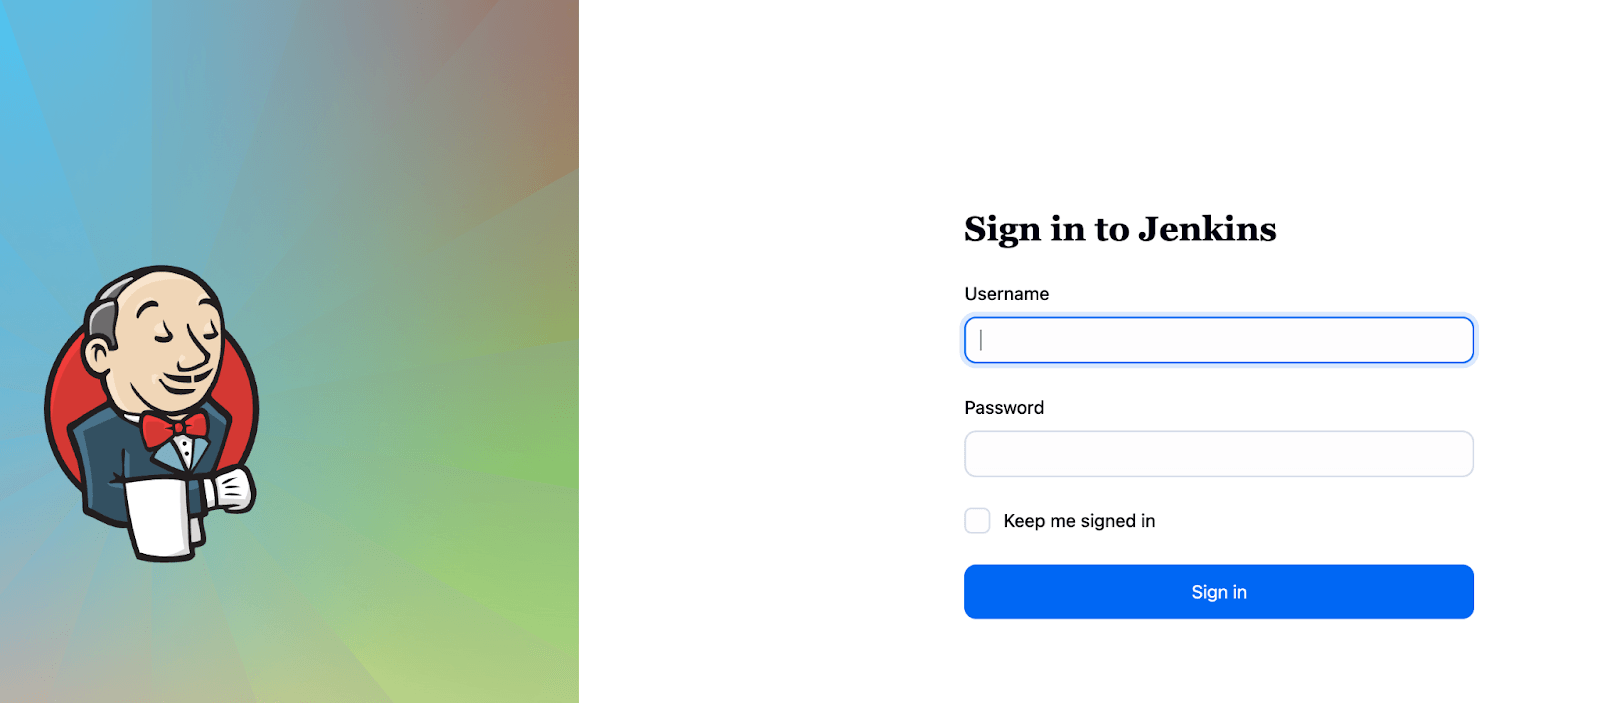
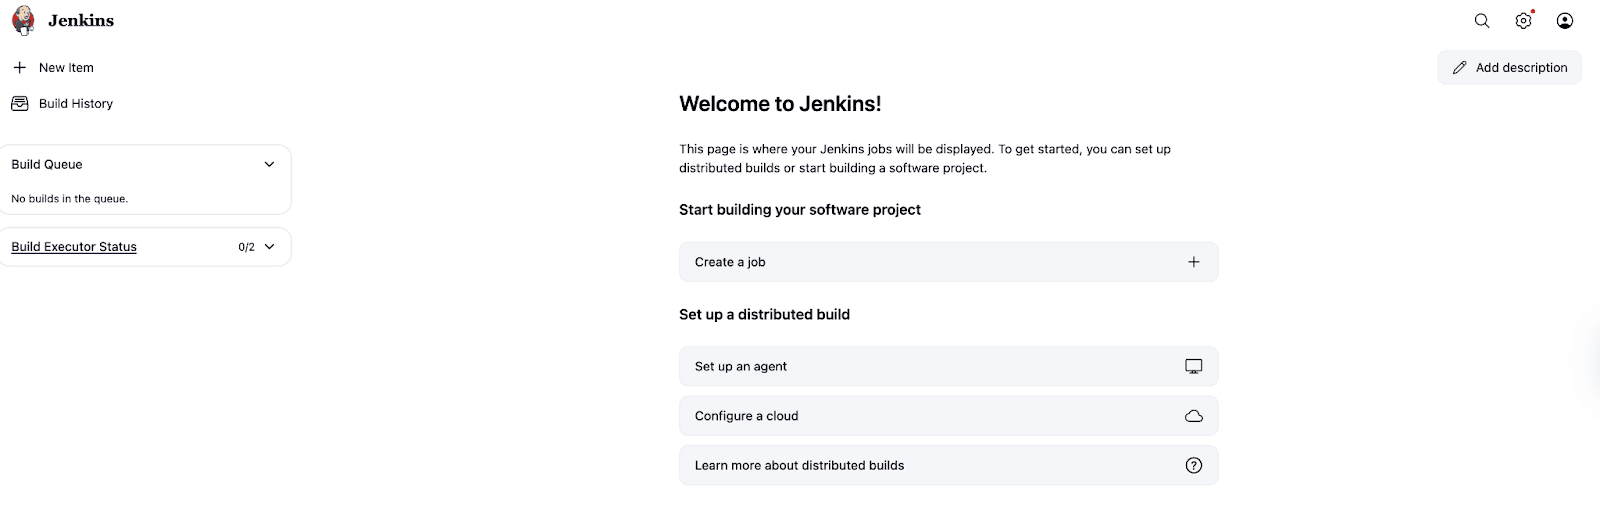
The initial admin password can be found in Config -> Secrets, and the username is user. As soon as you put these credentials in, you will successfully login to Jenkins:
If you want to see Lens K8S IDE in action, download it today.
Using CRDs from Lens K8S IDE
For this example, we will deploy Cert-Manager using the terminal inside of Lens K8S IDE, and then explore how this is visible inside the product.
To do that, we will simply need to run the following command:
kubectl apply -f https://github.com/cert-manager/cert-manager/releases/download/v1.15.0/cert-manager.yaml
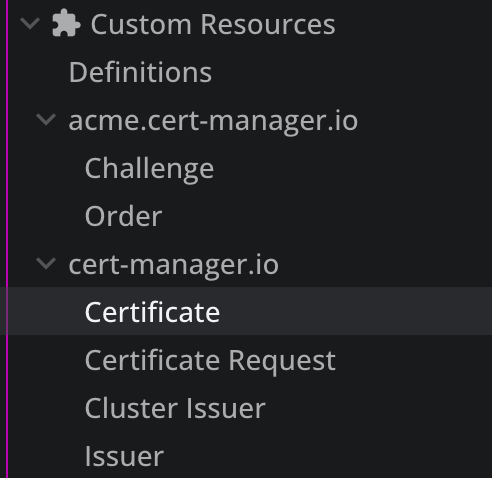
In Lens K8S IDE, if we navigate to Custom Resources, we will see that two new definitions have been added:
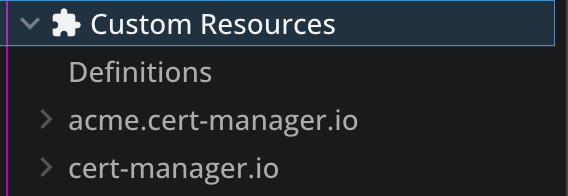
By expanding these definitions, you can easily see what kind of resources you can create:
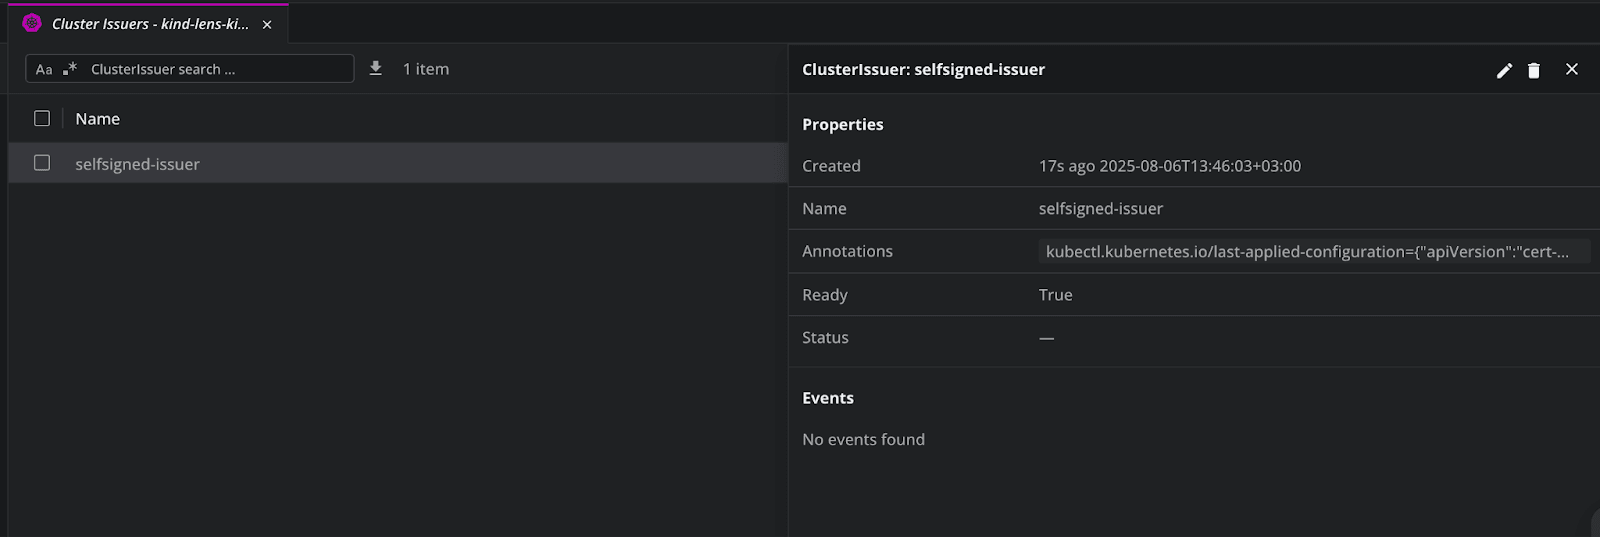
I’ve created a dummy cluster issuer, and as soon as I’ve created it, we can see it in Lens K8S IDE:
How to use the AWS EKS one click integration to Lens K8S IDE
Before this integration was available, Lens K8S IDE supported EKS clusters by leveraging the AWS CLI and the credentials available on your local machine.
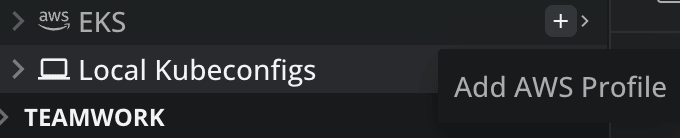
Now, you can easily integrate with AWS EKS with one click. To do that you can easily click on Add AWS profile.
Next you will need to choose how you want to authenticate:
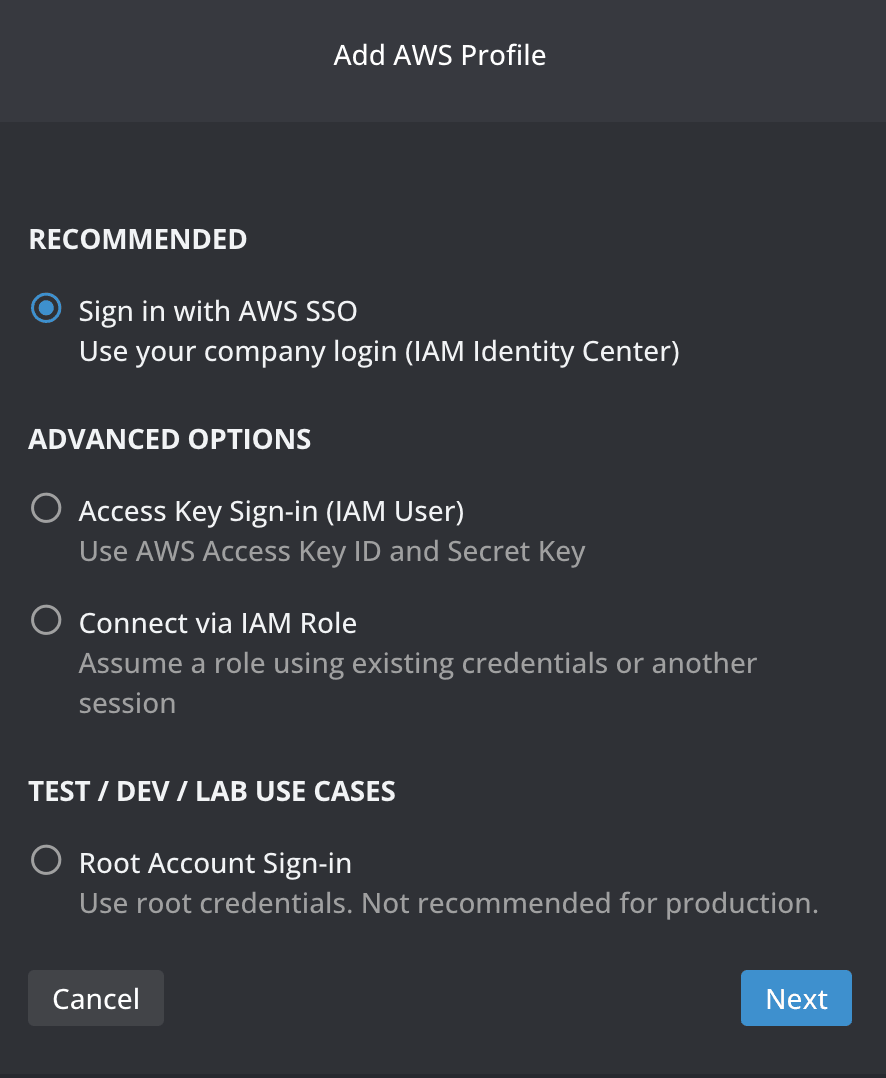
As soon as you go through the steps based on your authentication method, Lens K8S IDE will instantly discover all the EKS clusters you have access to, across different accounts and regions.
All the clusters will be populated under the EKS tab, and you can connect to either of them with a single click, and do everything that was shown throughout this article.
For more information about the one click integration between AWS EKS and Lens K8S IDE, click here.
Lens Prism: AI-Powered Kubernetes Copilot
Lens Prism is a first-class citizen inside of Lens K8S IDE. It gives you the ability to manage and troubleshoot K8s clusters using natural language prompts, rather than requiring you to use kubectl or inspect everything in Lens K8s IDE.
Lens Prism connects to an OpenAI compatible LLM, ensuring that all your data stays local by default. It supports multi-turn conversational queries, meaning that you can also ask follow-up questions, making the debugging process easier. Apart from answering generic questions, it can deep dive into your errors, and even provide solutions that you can easily implement.
To configure Lens Prism, you will initially need to click on Prism AI in the top right corner:
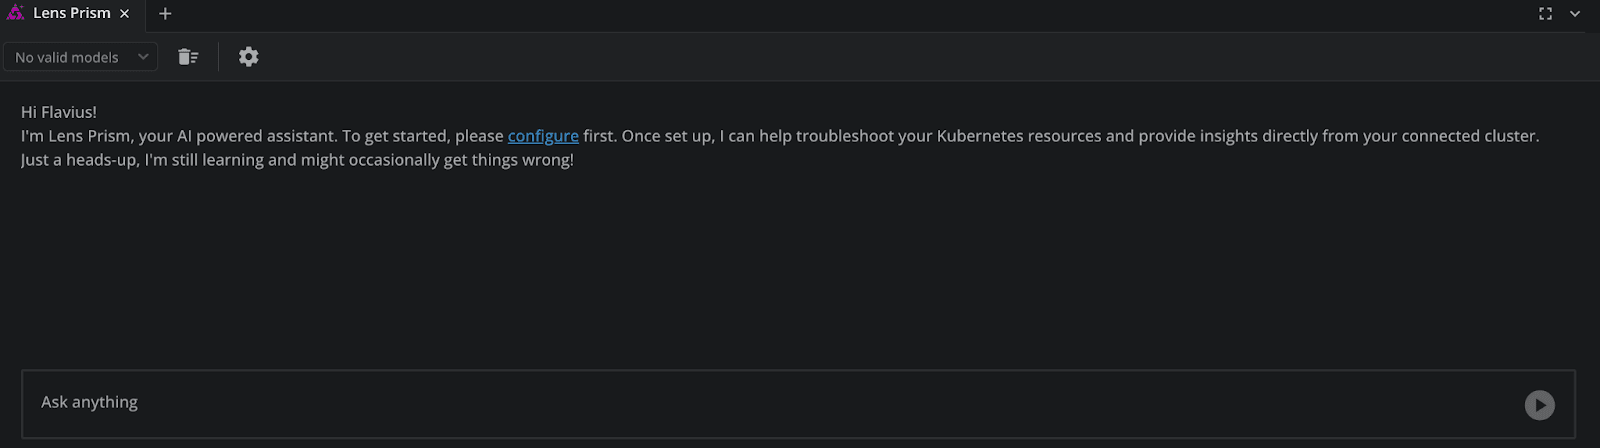
Then a tab will open in the bottom part of Lens K8s IDE, that tells you that you need to configure it first:
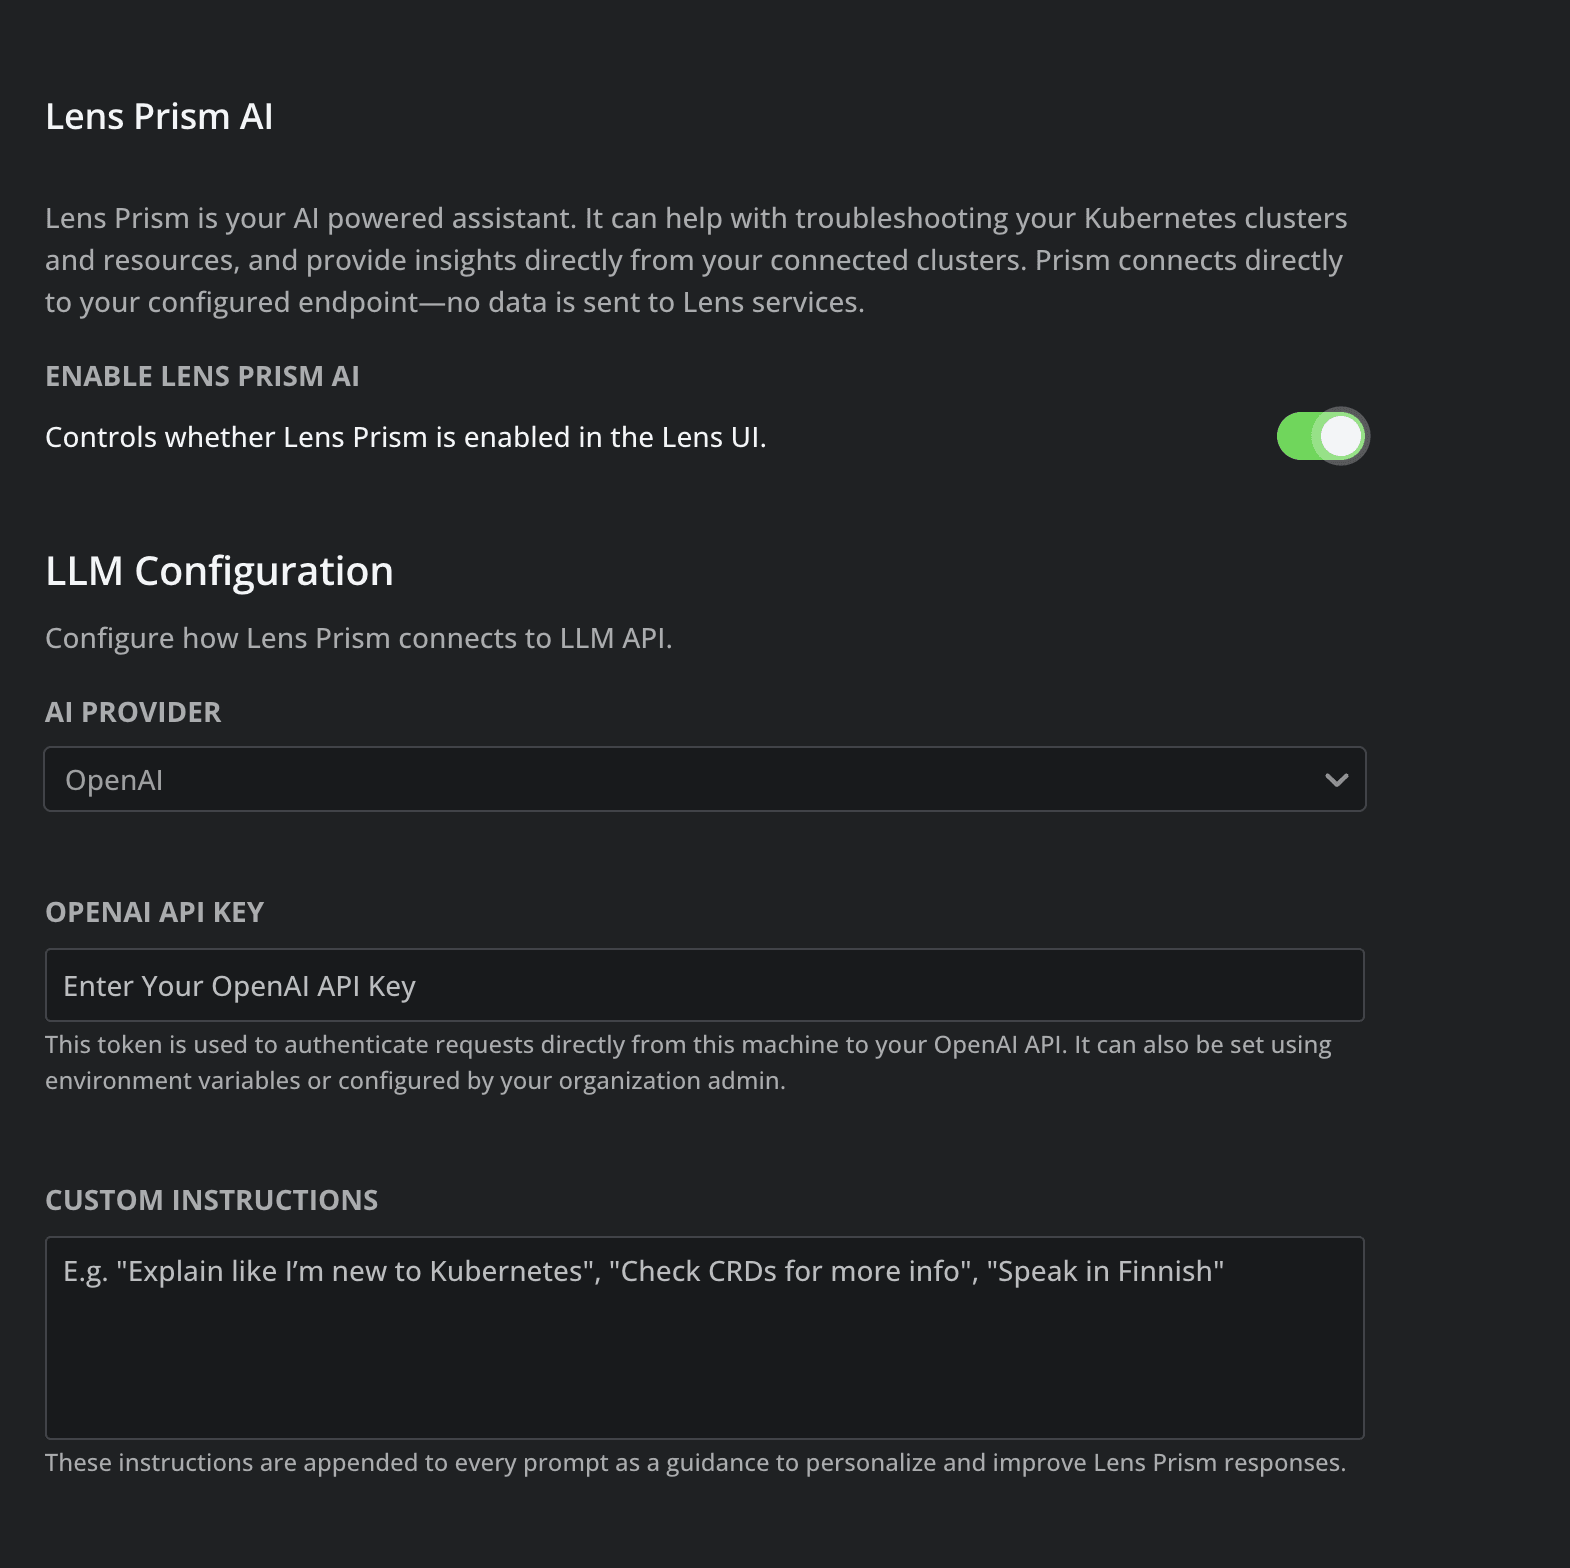
You will need to enable Lens Prism, and then select your AI Provider, and add your API key:
As soon, as you’re done, you can chat with Lens Prism about everything that is happening in your K8s clusters.
You can also configure Lens Prism preferences through environment variables. Check out the guide here to see how this can be done.
For more information about Lens Prism, check out this article.
Lens K8s IDE pricing
Lens K8s IDE pricing plans are divided into two clear categories, each of them, having different pricing flavours:
- Individuals
- Personal – Best suited for individuals: students, small organizations or hobbyists
- Plus – Best suited for individuals from organizations
- Organizations
- Team – Best suited for startups, small teams, or larger organizations that are currently evaluating Lens K8s IDE
- Pro – Best suited for larger organizations who want to use Lens
- Enterprise – Best suited for organizations that want to deliver increased security, governance, and compliance
Each pricing flavour offers different features, so for more information about what is included, check out our pricing page.
Key points
Using Lens K8S IDE saves you a lot of time when it comes to Kubernetes management at scale, because you don’t need to juggle tens of terminals and different kubectl commands to do your job. You should keep in mind that Lens doesn’t promise to be a kubectl replacement, but a complement that makes your lives easier and equips you with everything you need to manage Kubernetes.
Lens K8s IDE offers unparalleled visibility even when you manage K8s clusters at scale, and equips you with all the tools you need to view, manage, and resolve bugs inside your clusters. By supporting Helm and any CRDs, you don’t need to worry about remembering all the resources names, or manually tracking their relationships. With intelligent search, contextual navigation, built-in terminal access, and the ability to go through logs, you can easily move from identifying an issue to applying a fix in just a few clicks.
With features such as Lens Prism, AWS EKS one-click integration, SSO integration, integrated metrics, role-based access control, and Azure AKS one-click integration (will be released soon), Lens K8S IDE becomes invaluable for enterprises that leverage Kubernetes in their day to day operations.
Lens K8S IDE is constantly evolving, and listening to its users. We are constantly working on delivering new features to our customers, and empowering them with everything they need to make their K8s journey easier. Stay tuned to see what else is coming.
If you want to see Lens K8S IDE in action, download it today.